
Statistics
Menu: Config » Statistics
The statistics of a roast appear post roast on the right side of the screen. Post roast, the placement and formatting of the statistic summary has been improved to make things more readable. You can now save the Statistics box to a file so that you can print it for a coffee bag. The format is PDF or text on both a Mac and Windows. You can also change the background color and opacity under the Colors settings. What goes in the box is determined by what you put in Roast Properties dialog as well as batch prefix/number, roast number of the day, ambient data (temp/humidity/pressure),machine name and drum speed.
These selections allow you to see the three roast phases in the classic Artisan colors (green, yellow, brown) at the end of the roast, with the items you check: time, bar, average ROR, AUC, evaluation (descriptive words). Phases example with the time, bar and F/min:
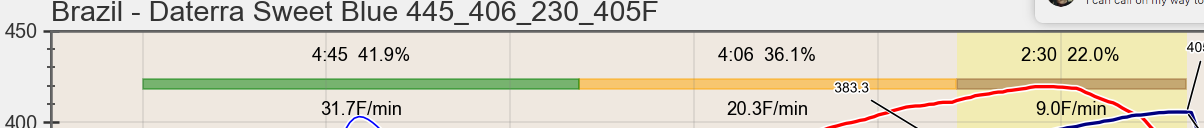
You can also see the temperature change in each phase in addition to F/min.
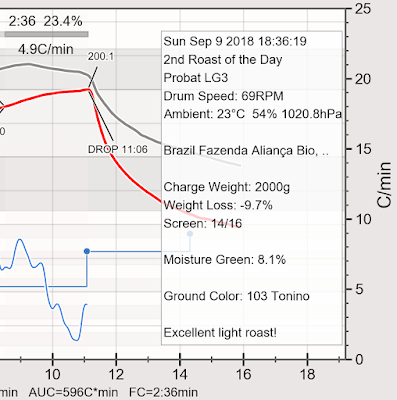
The Characteristics, at the bottom of your graph post roast, show basic information on the roast, like date, time, beans, batch-size, roast-loss, on the x-axis label if you have entered some of this information in Roast » Properties. Time after First Crack is now shown as a Characteristic at the bottom of the chart. You have to enter Charge and Drop in order to get statistics which can be either manually via an event button or automatically.
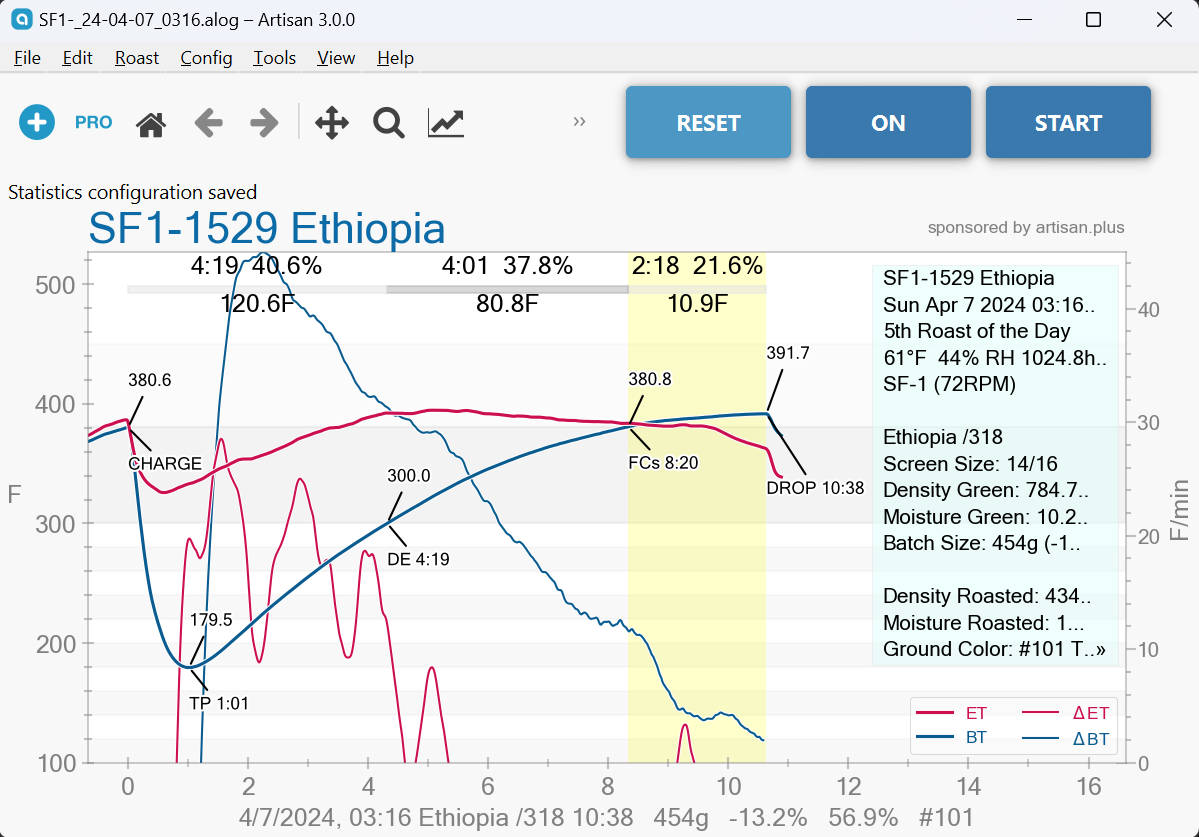
Sample post roast showing Characteristics at the bottom of the graph and Summary Box on the right:

Advanced Summary Statistics
You can choose which statistics to display. Managing the view of statistics is done on the new “Stats Summary” tab in the Config» Statistics dialog. Notice that the “Show summary” checkbox was moved from its previous location to this tab. Click that checkbox to display the summary statistics.
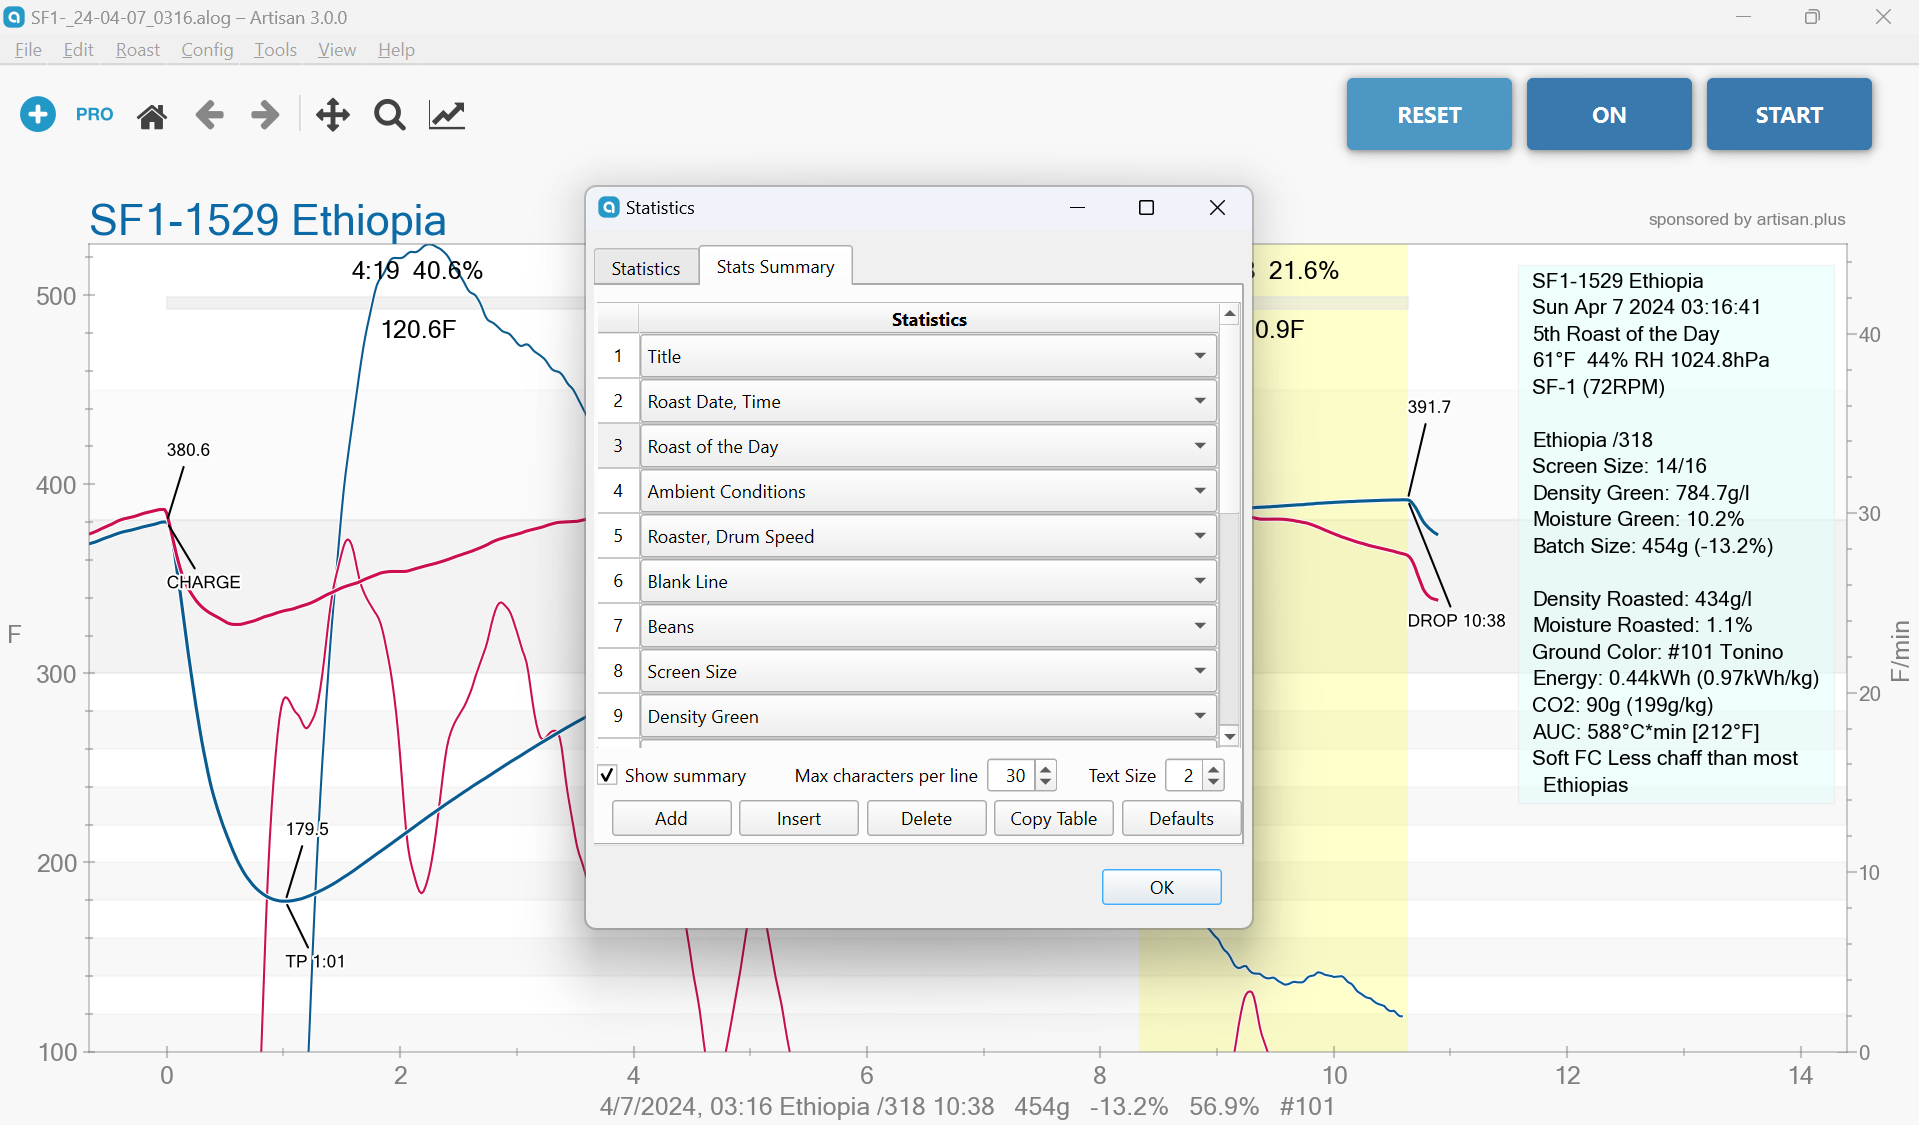
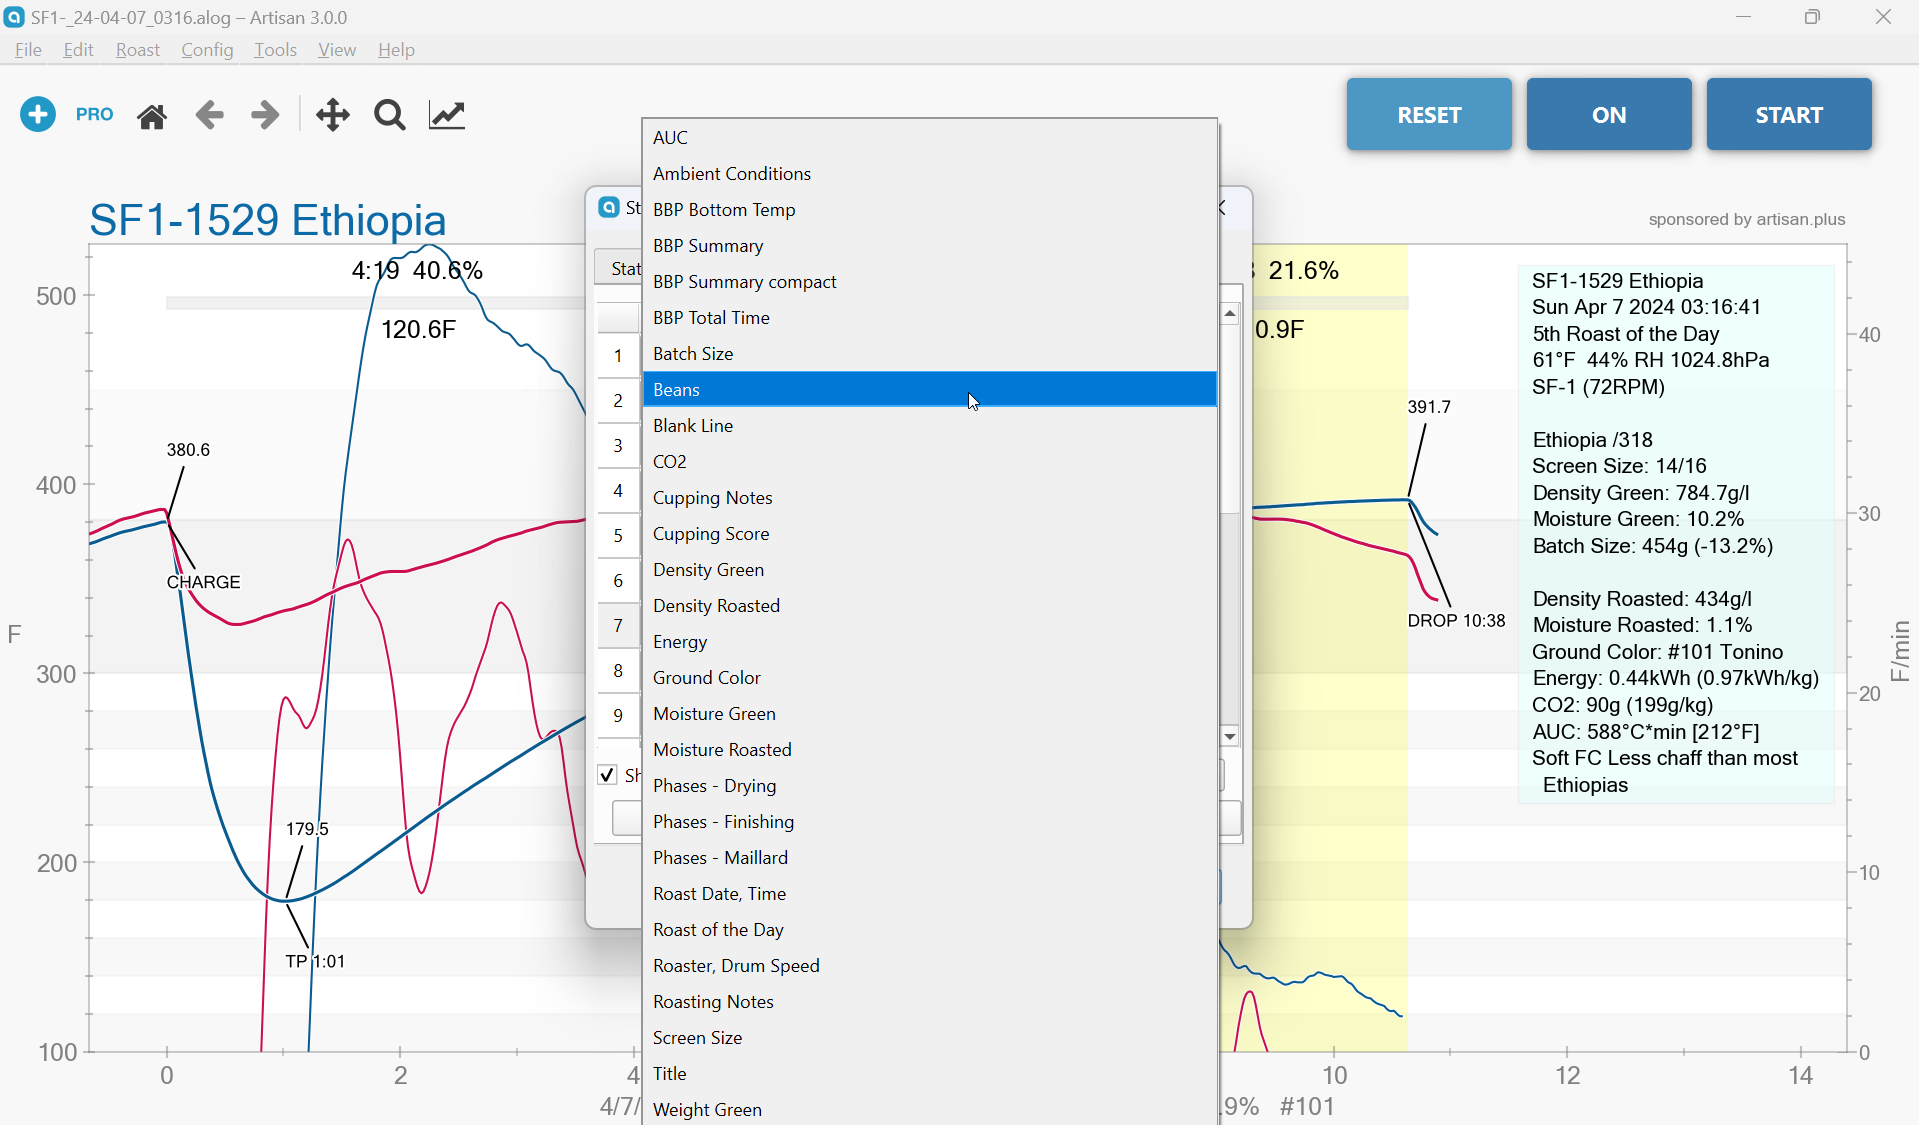
Click on one of the statistics in the table to choose from a list of available statistics. The graph display will update as you make changes in the dialog. You can change, add, insert, or delete statistics in the table to create your own custom summary statistics display.
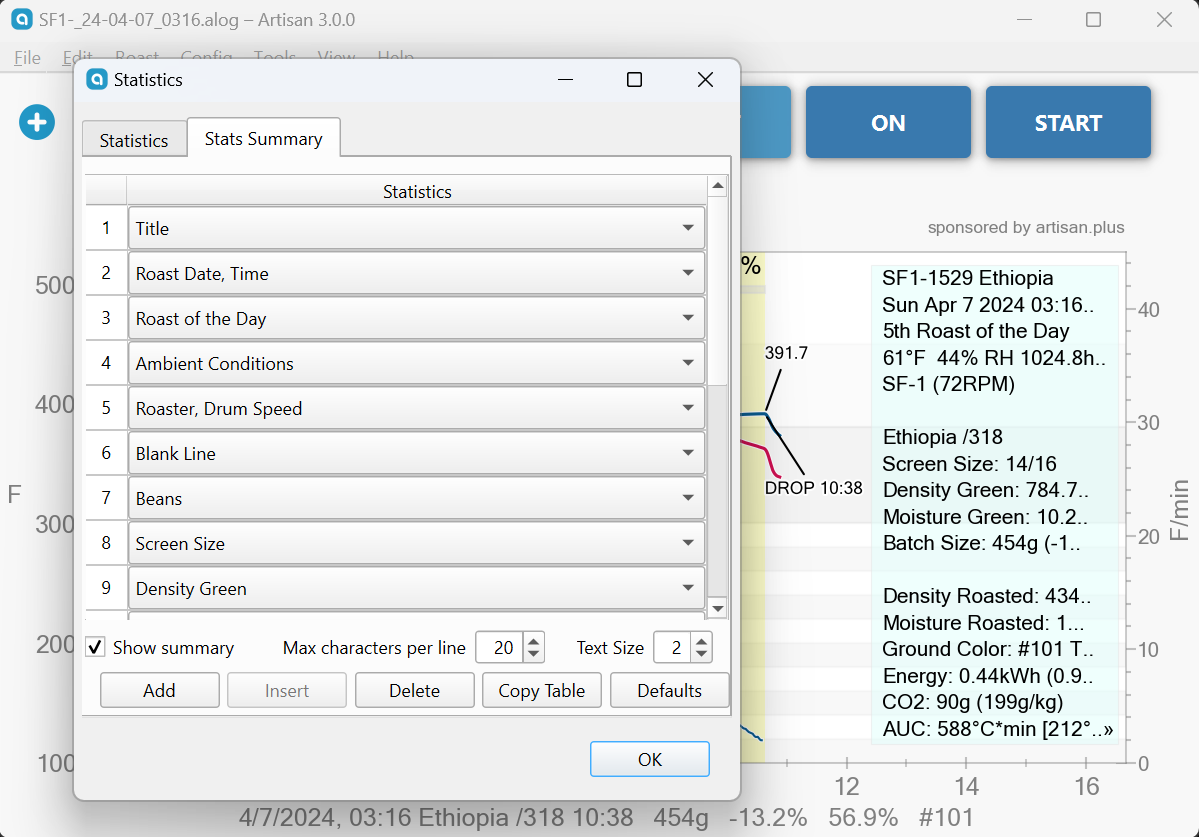
The “Max characters per line” will set the width of the statistics box. Most statistics will be truncated after that number of characters. Double periods (..) are shown when a line has been truncated. When there are more lines information to display than the statistics box can hold an indicator will be placed as the last character.
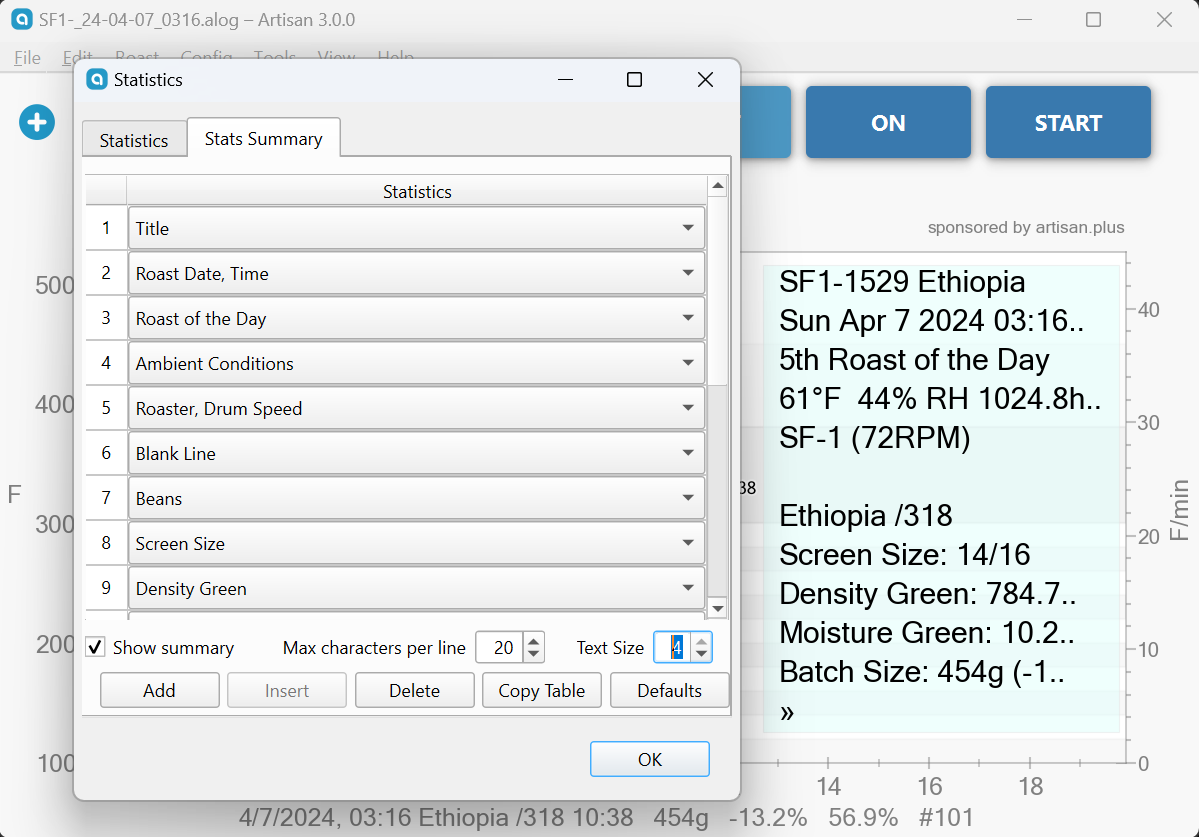
Change the text size used for summary statistics. The choice of font is still made in the Config» Curves» UI tab. The choice of font affects all of Artisan whereas the “Text Size” setting only affects the statistics summary.
When displaying summary statistics it is recommended to enable “Auto Time Axis” (Config» Axes). Artisan will automatically adjust the time axis so the statistics box is to the right of DROP and not covering important profile information. The statistics box will shrink to keep the legend visible when the legend is set to either “upper right” or “lower right” (Config» Axes).
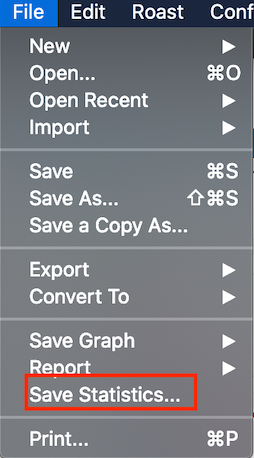
Users asked for the ability to print out the statistics. File» Save Statistics» PDF will generate a PDF file with the statistics as they are currently shown on the graph. File» Save Statistics» Text will generate a text file where all the configured statistics are included and not truncated by the “Max characters per line” setting. Be aware “Notes” statistics are always truncated.
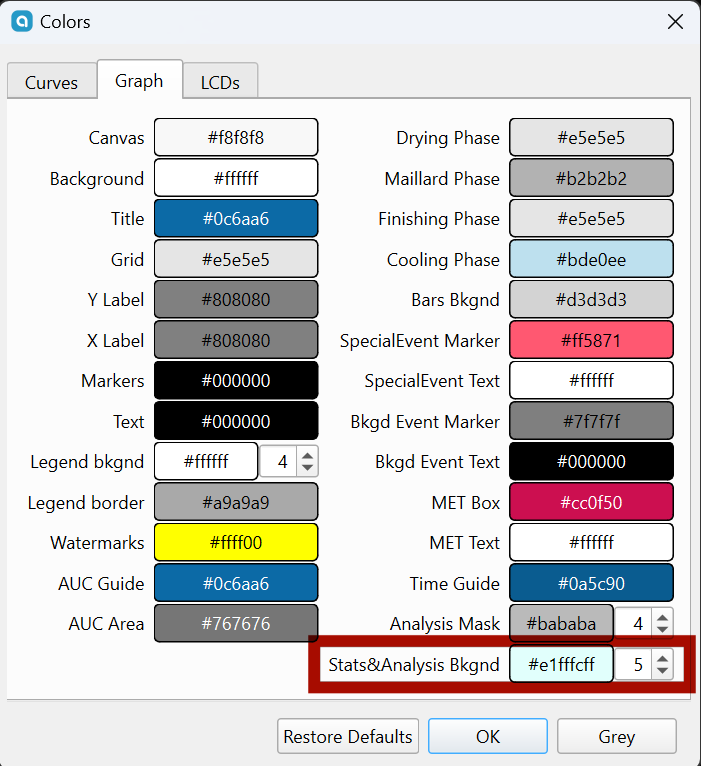
To change the background color of the statistics display go to Config» Colors» Graph tab. Look for “Stats&Analysis Bkgnd” where the color and opaqueness can be adjusted. This setting also affects the Tools» Analyzer results.
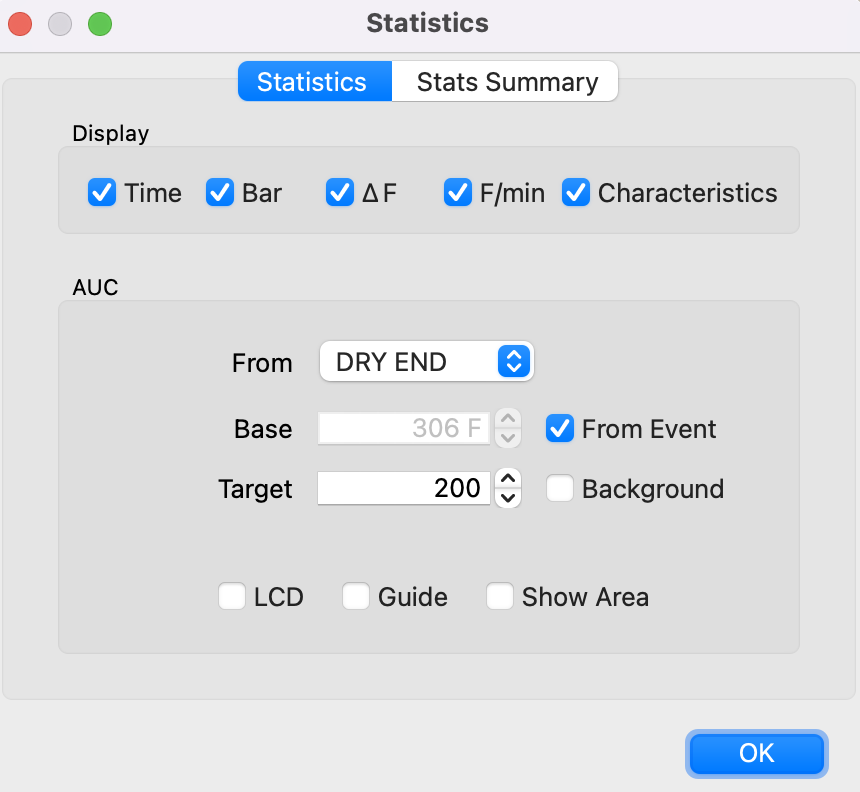
Statistics – Area Under Curve
AUC is not a curve to be recorded, but a derived parameter computing the area below the bean temperature curve and above the “base temperature” (specified in the dialog) from the start event (specified in the dialog) and the current moment in time. You can decide to measure AUC from a “base temperature” or from a selected “start event” such as Dry End via a check mark. You can additionally specify a target AUC value you are going for, or take the AUC of the background profile as target. Based on the target you can let Artisan compute a “Guide” (via check mark), a thin line at the moment in time the target AUC value might be reached. You can have the current AUC show in an LCD during the roast. You may be able to right click the LCD to change it to countdown mode rather than the current AUC.
AUC is “the idea that the area under the temperature curve could be an indicator on how much total energy the beans might have receive during the roasting process. While the rate-of-rise (RoR) of a temperature curve, calculated as the first (discrete) derivation, gives the current “speed” of the temperature increase or decrease and allows to predict the future, the area-under-the-curve (AUC) describes the past.
Initial users have suggested that using Dry End as a reference point is good because this allows comparison of AUC across different setups to account for the variations of temperatures (and probe placements). The yellow point can easily be observed independent of equipment and the amount of energy “blown” into the beans before DRY might not be too important for the end result.
You can now see your Area Under Curve. AUC will also be recomputed for ranking reports based on actual AUC settings under Config » Statistics. This will make AUC very useful in ranking reports. Generally, AUC is a useful tool to compare roasts of the same bean. More details can be found here, and on Frans Goddijn’s excellent blog and on this Home Barista thread.