
Events
Menu: Config » Events
Creating Events allows you to record data to be shown on your roast graph with either Buttons or Sliders. You can have multiple labeled sets of Events and manage them in the tab labelled Pallets in the Events dialog box. Only Button definitions from the Buttons tab are saved in these pallets. Events allow recording of data into your roast profile and when used with Alarms allow for automation of the roasting process. Some of the choices here are only available in the UI mode, Expert. Config » Mode
Artisan’s standard buttons are as follows:
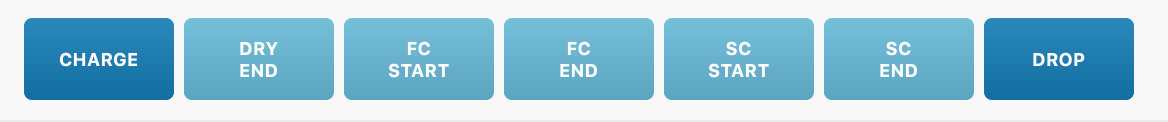
The buttons above contain key time points in your roast and after using the trier in the roaster, you would push the button when the event occurs. The buttons table can down be downloaded using the Copy Table button. Pushing these buttons during a roast will add data to your roast log. You can find the data under Roast » Properties, Data tab. The Data and Events tabs can be downloaded using the Copy Table button on those dialogs. The custom event buttons themself come in three sizes (tiny, small and larger). This can be configured in the buttons tab of the Events dialog (menu Config » Events, 2nd tab).
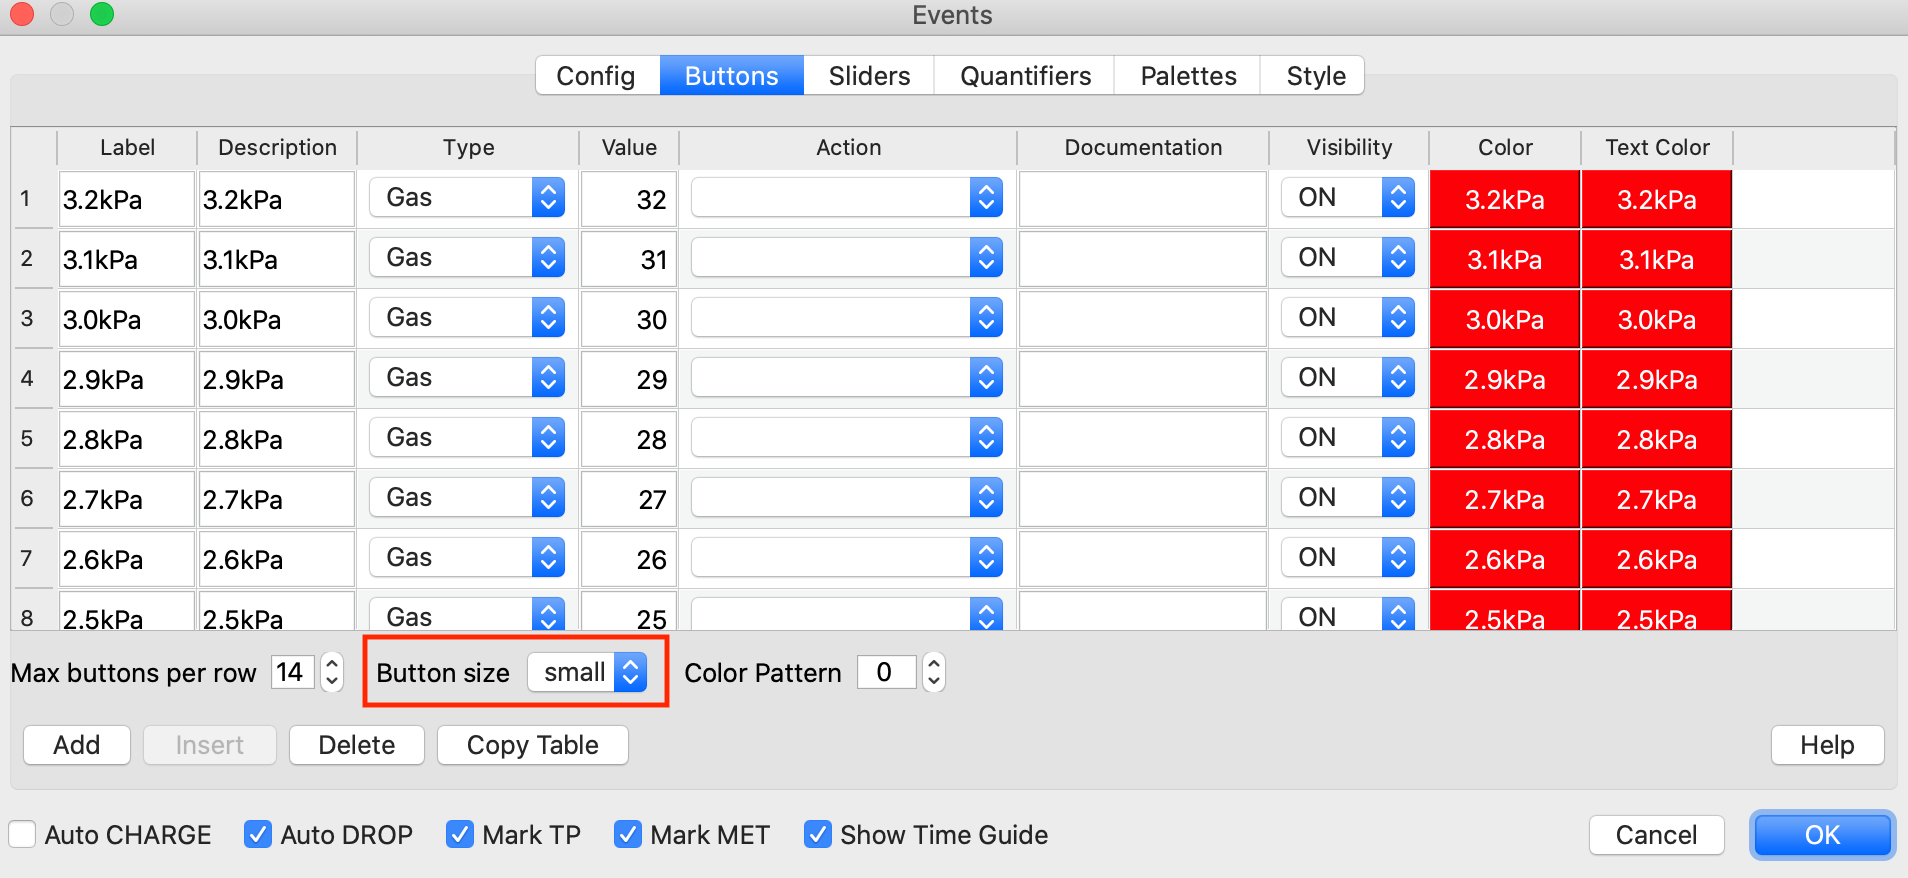
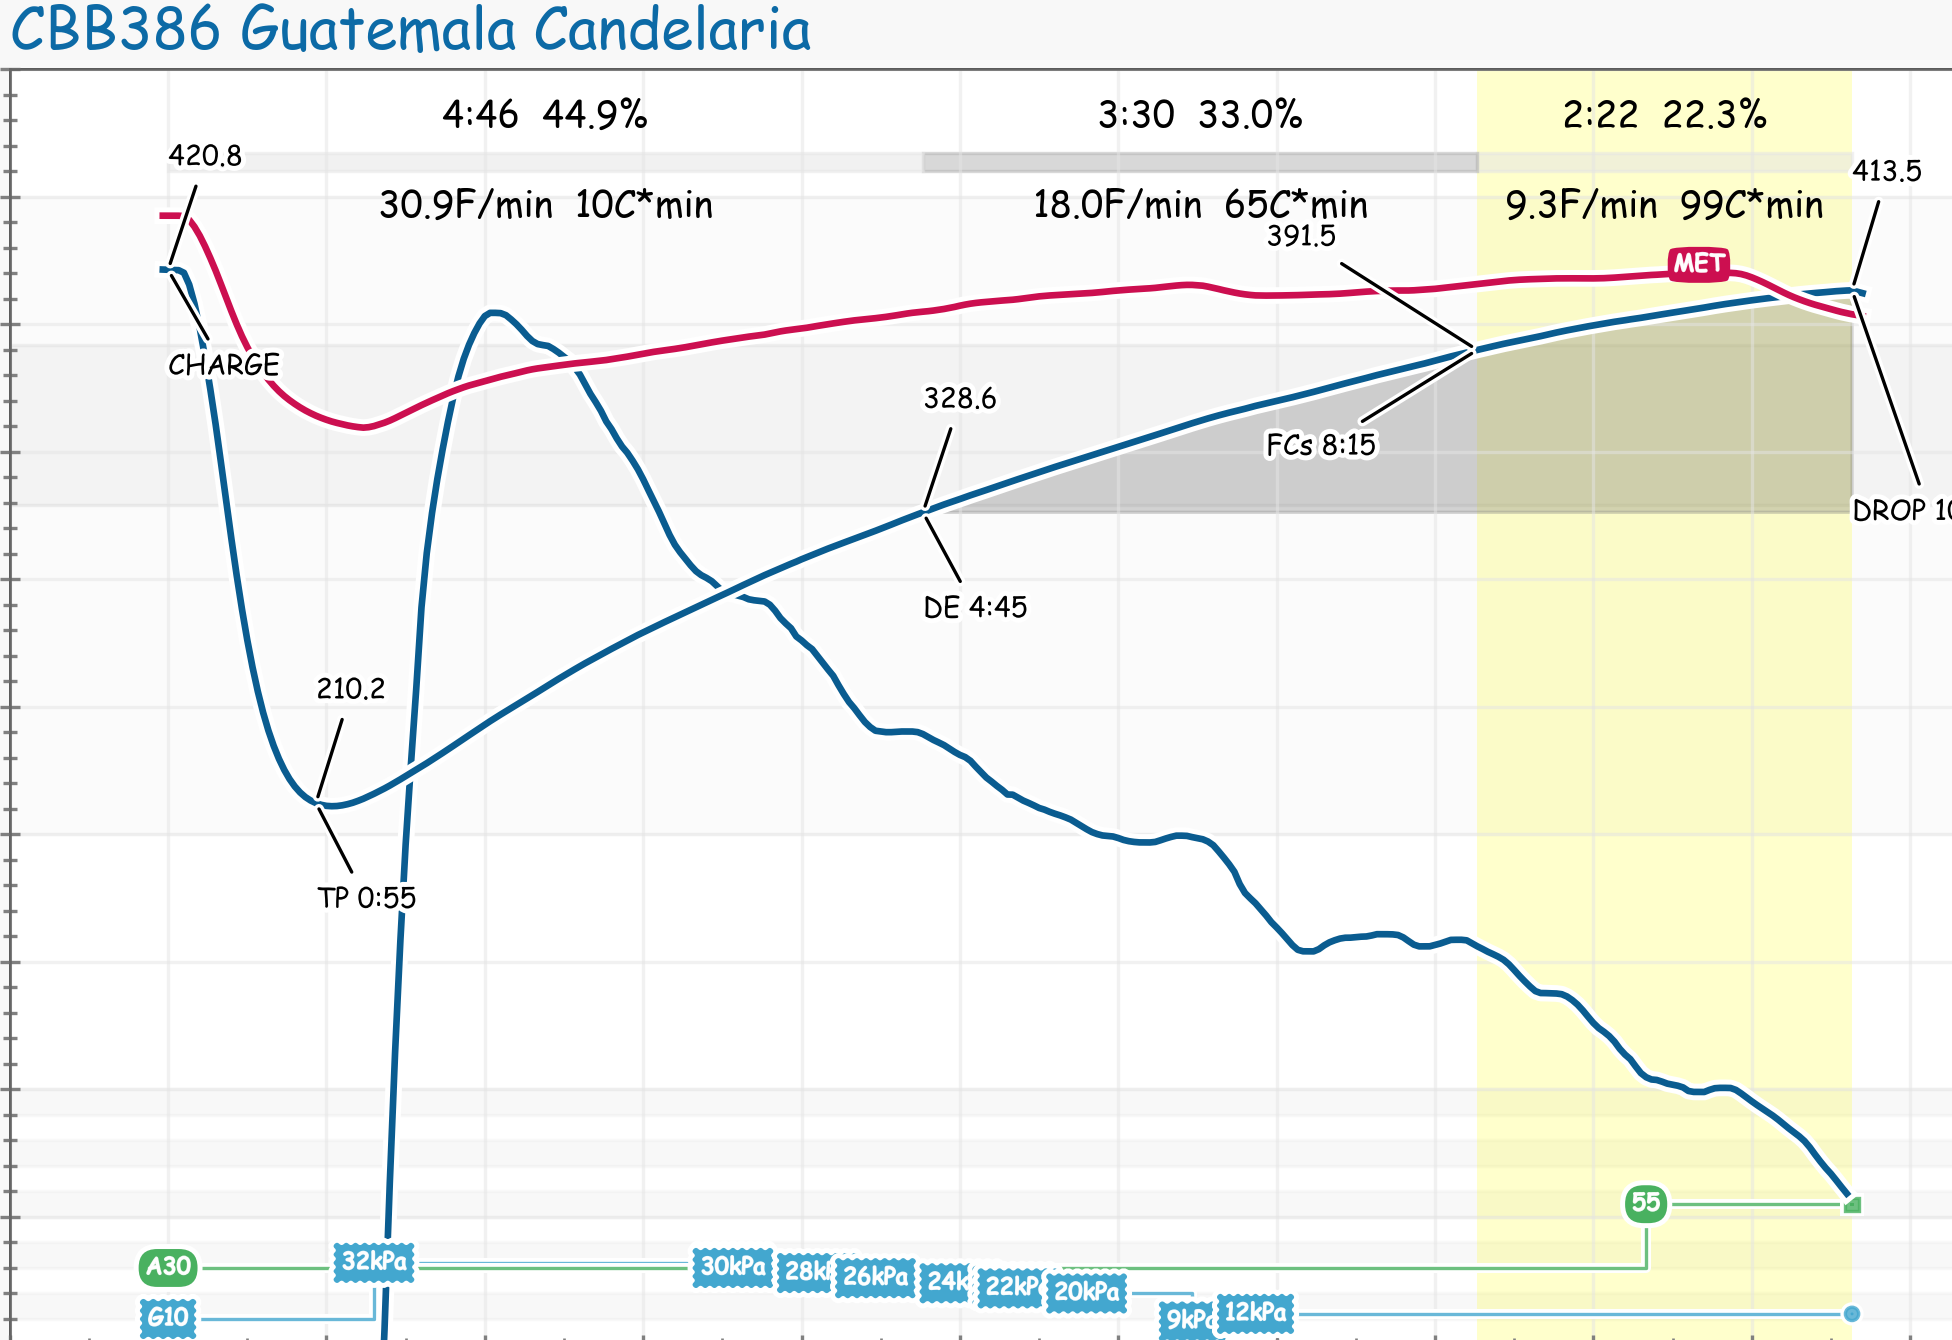
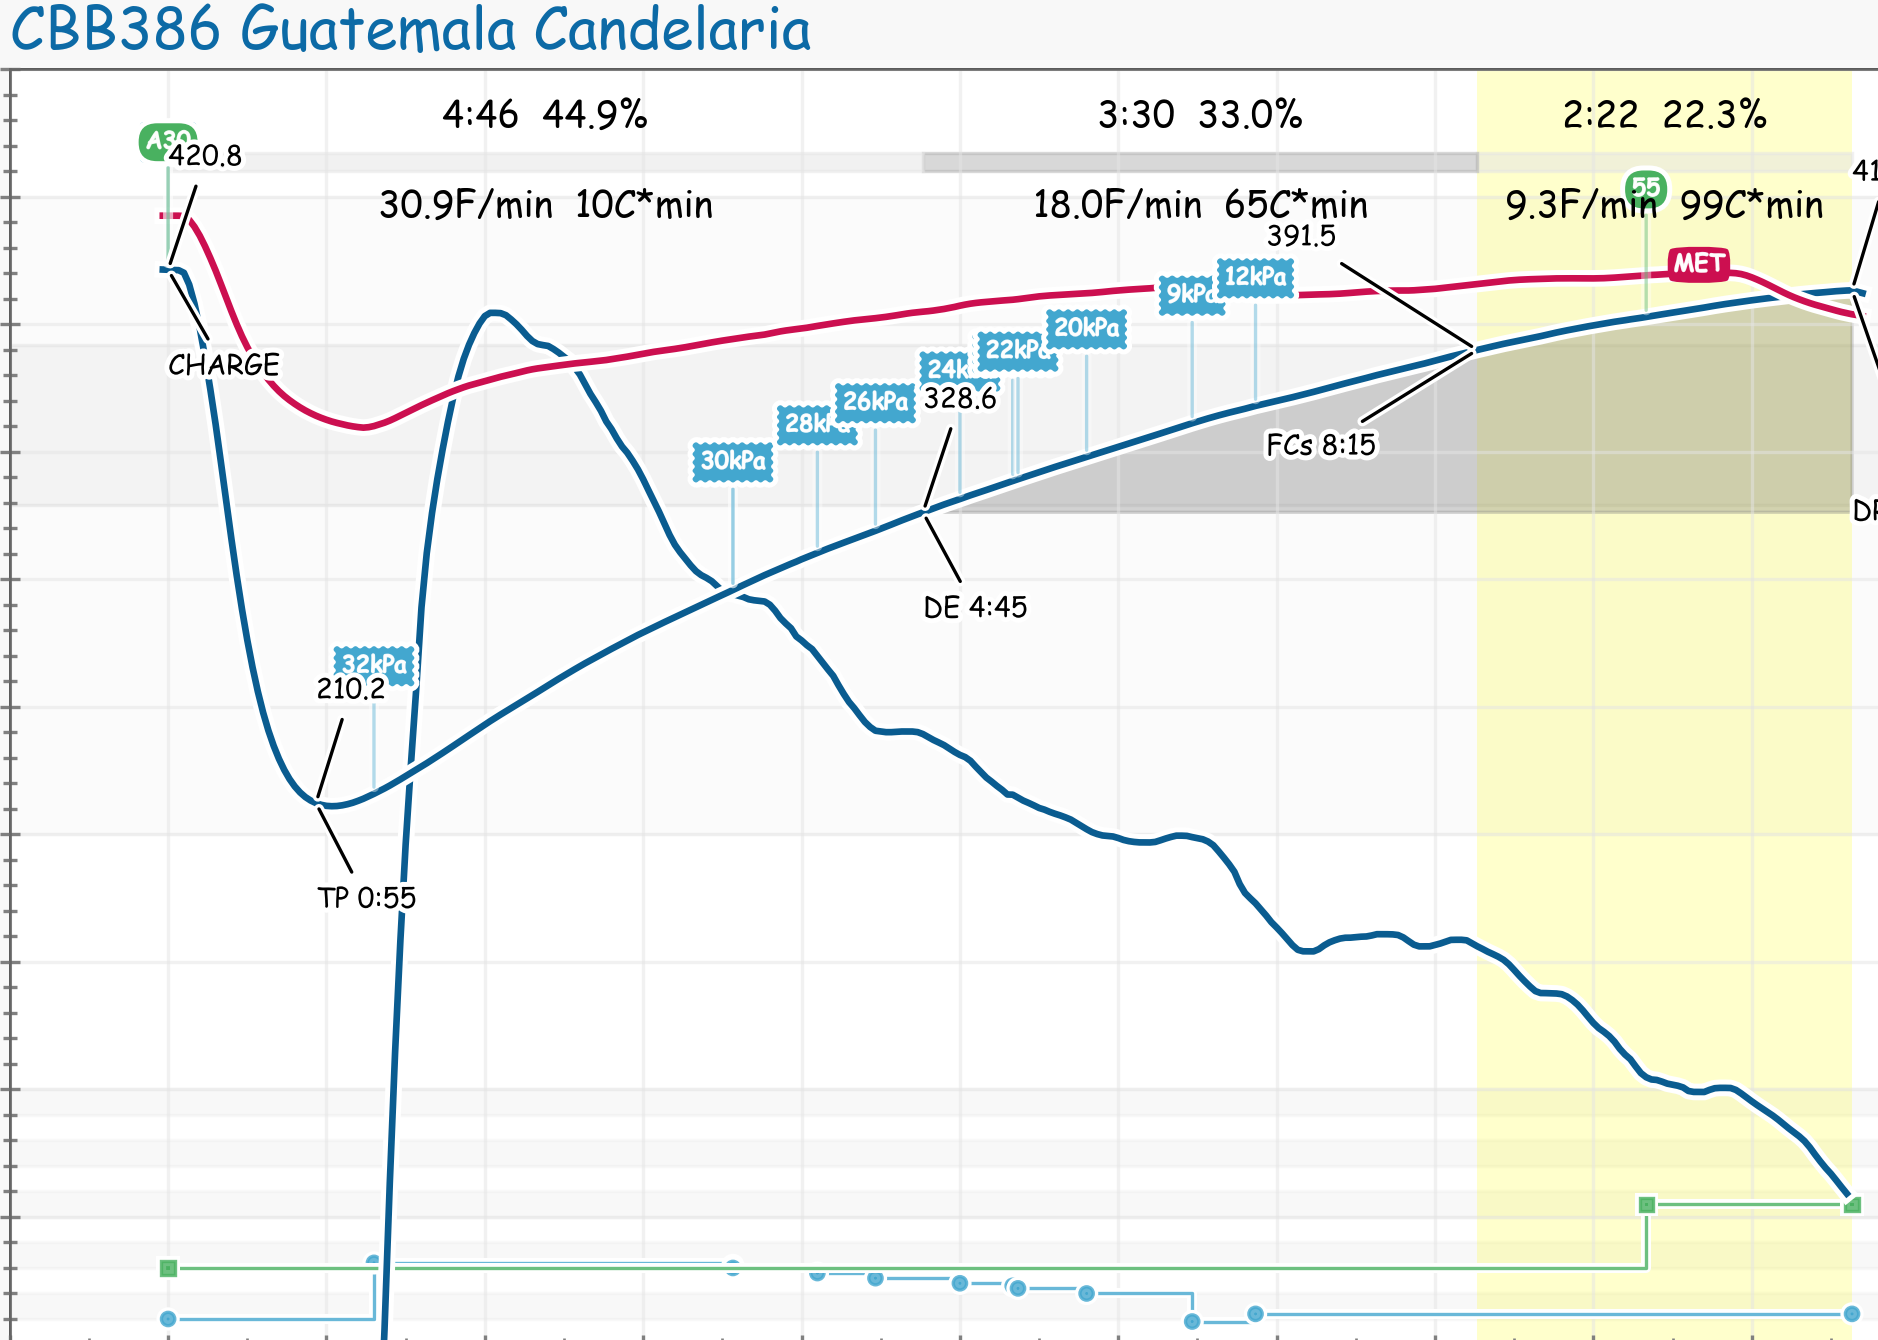
Sliders can be used to create Events as well. The sliders appear on the left side and can be used to input a variable value between 0 and 999. Make sure you check Decimal Places under Curves » UI if you use them. Your events will be rendered on your graphs (if you have the Events checked on the Sliders tab) with the first letter of the name of the event and two decimal places. So Gas at a value of 35 would be G35. Or if you don’t check decimal places G3.
You can define up to four custom Events such as Gas and Airflow. Red buttons are Gas readings on propane and the Blue are Fan settings in the example below.

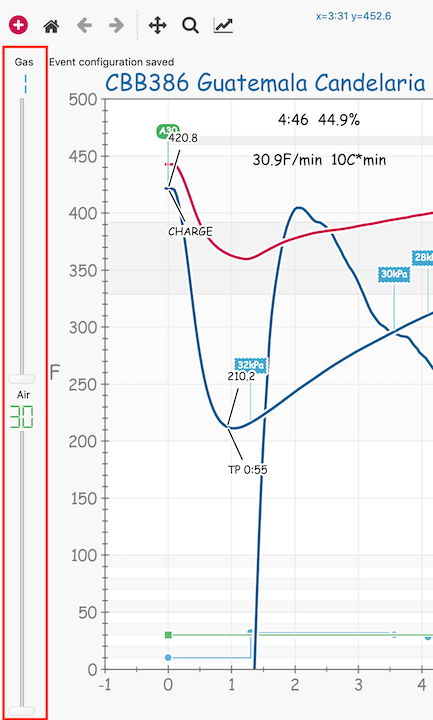
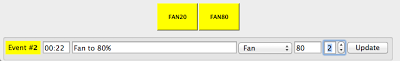
And here is what a slider looks like. NOTE if you have sliders checked on the config tab the initial value will be recorded into Artisan at the start of the roast:
In order to set up custom events, you need to create Event types, under Config » Events:
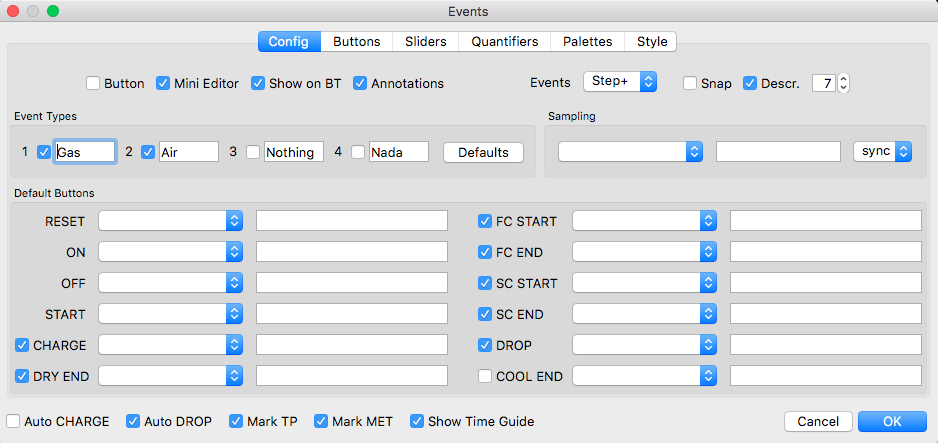
You can label up to 4 event types. You can edit how they work with the tabs Buttons and Sliders. When you click a button or move a slider Artisan records an event on a scale of 0-999. You can display these events on your roasting graph. You may need to set your temperature axis to a low of 0° in order to see these the best. Config » Axes. In the image above you can see that for the Default Buttons, you can enter Events to be triggered when the button is pushed. The types of Commands are shown by pressing the Help button on the Buttons tab.
The mini Events Editor is available at any time and can be used to edit events while roasting or to browse and edit custom events of a profile later. It an be enabled via the menu entry Events Editor from the View menu or simply by pressing the y key.
You have the option to render event values or descriptions instead of values. A value would be for example a gas setting that your have set with a slider so if your event button is Gas and the value is 32 it would render G32. In that that, case don’t check the description box. If you check the description box, it will describe the event. For example A3(S0) would mean Alarm event 3, slider 0.
Use the event button type “–” that creates an event adding labels to the graph rendering its button description. For those using sliders the rendering will continue to be the first letter of the Event name and two digits of the value IF you check Decimal Places under Config » Curves, UI tab. If you don’t it will render only one digit.
During a roast it is now possible to have Artisan draw a line at the current point in time, which helps to compare the current roast state with that of the template (RoR, background event markers,..). You can activate this feature in the Events dialog (menu Config » Events) by ticking the flag Show Time Guide. This helps you see Events you have in your Background roast profile.
Rendering Events on Your Curves
To see the values of the TP, DE, FCs etc, check the box for Annotations. You can now drag these Annotations if they are covering something else you want to see to move them on the graph.
For Events that you have defined, you will see to the right of the Events a dropdown box called Markers (see image above) with the following options:
Flag will render an event either on your ET line or your BT line (check the box “show on BT”) and your event value or description if you check the box for Descr. (number represents how many letters). If you are using values, the first letter of your event name and the event value will be rendered.
Bar will show you a multicolored bar at the bottom of your graph with the first letter of your event name and the event value. Description is not relevant.
Step will show you a plot (step) graph with no values.
Step + shows you a plot graph plus your descriptors on the BT line (same choices as under Flag)
Combo shows you a plot graph with the descriptors on the plot (step) graph. Background events are rendered too.
Here are examples:
Combo
Step +
You are also now able to add an event type that will show on the graph when you hit the event button. With this new button type, you can define a button that will add an event item labeled with the description that shows up on the graph. You could record when you take a sample from the trier as an example.
Buttons Configuration Sample
The above screenshot shows the Button Label and Description, Type, Value, Action, Documentation, Visibility, Color and Text Color. The Label is what shows on the button. The Description is what shows on the graph, and as with Alarms if you want to enter a note to yourself on what the button does, use a “#” and everything after the # is not displayed. The Value is from 0-100. So you have to adjust your scale to that. For example if you are using 2.0-3.5kPa for gas you might have values 20-35. You can choose the button to trigger a machine control action such as change the Hottop heater. You can have the buttons visible or not and choose their color and text. You can drag and drop to change the order of the buttons.
ADVANCED USERS - The Action column is where you can add automation commands. Check the Help page for the Events dialog to see all the possibitites. The number of Artisan commands and other commands continues to grow with each release.
The autoCHARGE feature (menu Config » Events) allows you to have the hands free while charging the bean for the next batch, having the CHARGE event set automatically by Artisan. For those who prefer to set the CHARGE event manually by hitting the CHARGE button we now added the Charge Timer (menu Config » Events) as alternative. If active, the timer counts down the specified seconds after START until it automatically set the CHARGE event. With the Charge Timer set to 0sec, Artisan will set the CHARGE event to the first reading it records.
Note in particular the Automation check marks at the bottom. If you want the event Charge to be automatically recorded, you need to press Start and let it be on for 5x your sampling rate in order to have AutoCharge work properly. So for a sample rate of 2, don’t charge the roaster until at least 10 seconds after you push Start.
Sliders Configuration Sample
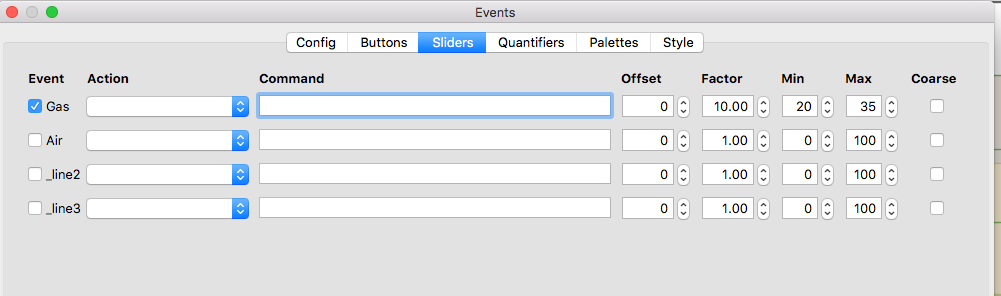 Min and Max are the key settings. The factor and offset are used to convert dial settings by advanced users to linear output.
Event Annotations
Step and Step+ have Annotation options allowing the user to customize the labels that appear on the stair steps. The user will be able to describe events in plain english with the strings. If your stair steps are too close together there is a setting in the dialog box, Allowed Annotation Overlap, which allows you to not render some the events. There is also a new setting under Config » Axes called 100% Event Step which adjusts where the stair steps show up on your graph. Please read the Artisan Blog post for more details. Remember,the special event annotations are only displayed when the Events display selection on the Config tab is Step or Step+:
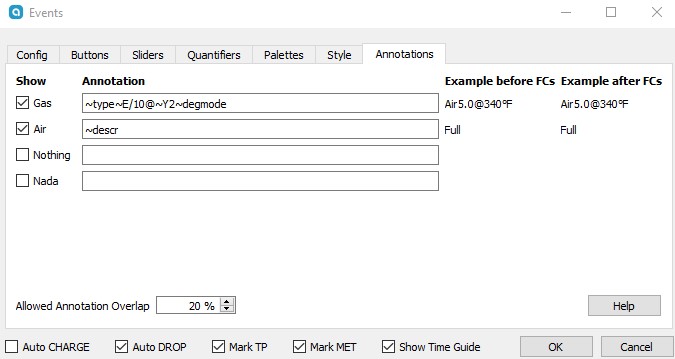
A sampling of the string choices:
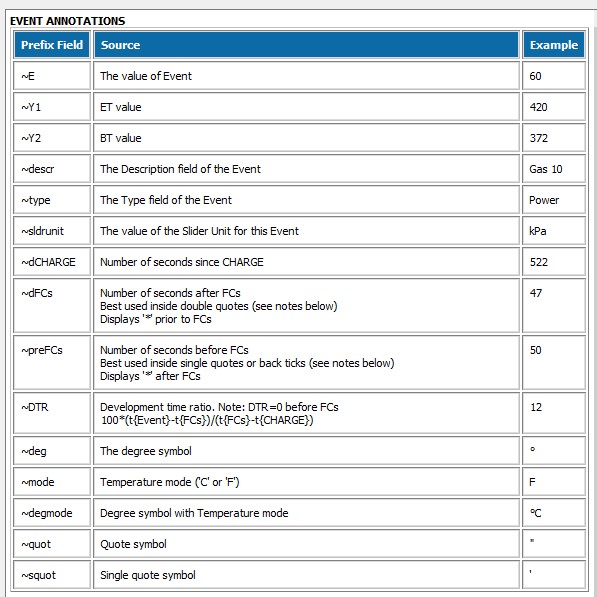
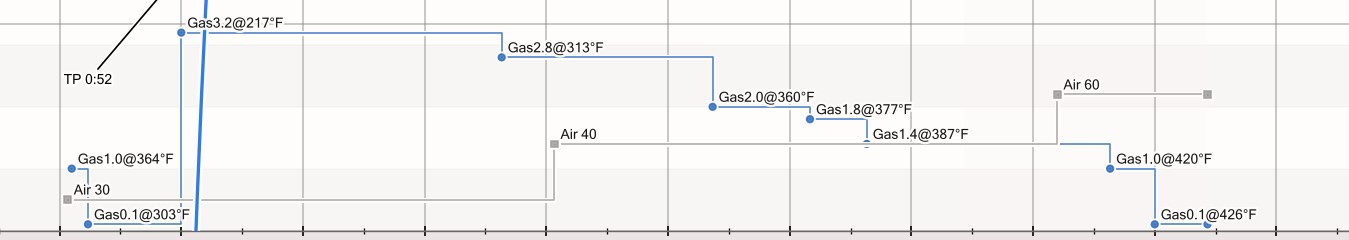
The examples:
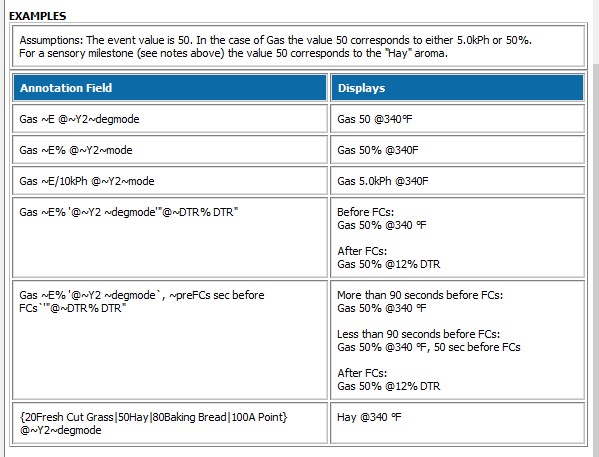
Sample result:
The text size used in the chart for annotations is platform and system dependent and also depends on your monitor resolution. Thus you can adjust to different dpi resolutions in the “Resolution” section of the UI tab in the Curves dialog (menu Config » Curves, last tab). Higher numbers increase the font size used by annotations.
Quantifiers
Quantifiers turn readings received from a connected device into custom events on their 0-100% scale. For example, if you have a channel configured to read burner output on a scale from 0-2000 you can decide to hide the corresponding curve (as it won’t fit into the range of the standard temperature axis) or turn just the changes of its readings into events by defining a corresponding quantifier. You end up with a more readable and useful profile.
Read more about quantifiers for advanced users.
Check out a video on the topic of Buttons and Alarms from an earlier version of Artisan by Michael Wright.
You can create multiple palettes of buttons as well to use in different roasting situations.