Curves
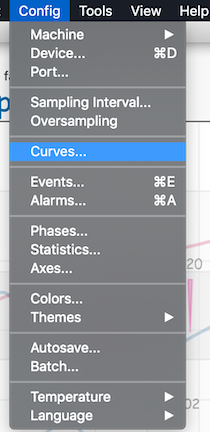
Menu: Config» Curves
These are critical settings within Artisan and for most the first two tabs will be where your focus lies. After you understand Curves, there are advanced roast analysis tools using the Analyze feature which is explained in an Artisan Blog article - Analyzer
First you decide which ROR curves and LCD’s you want to display by checking the boxes on the RoR tab of Config>Curves. NOTE you won’t see your ROR curves without pushing the CHARGE button during the roast.
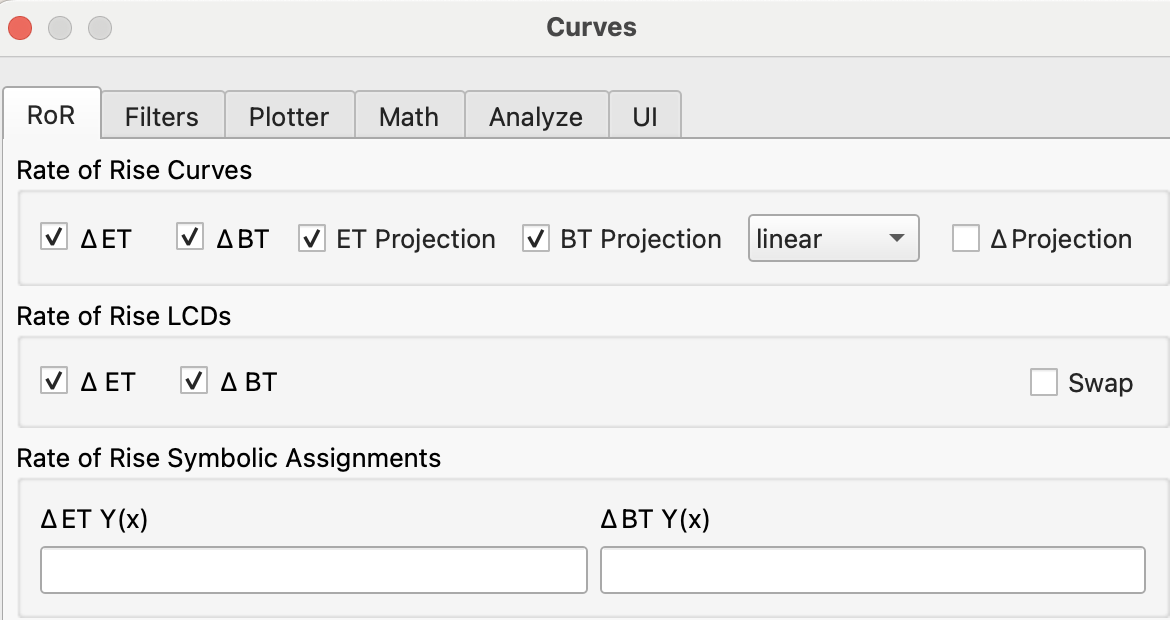
The order of Delta BT/ET LCDs can now be swapped (the BT/ET LCDs can be swapped in the device config menu).The position the curves are shown now respects the position of LCDs (from top to bottom). Thus if the DeltaET LCD is shown above the DeltaBT LCD, also the DeltaET curve is drawn above the DeltaBT curve (menu Config » Curves, 1st tab RoR tab tick swap).
On the filters tab, you determine how you want the curves to display. If you want the curves to be the same during and after the roast your settings will be different than if you want additional post roast filtering/smoothing. These are critical settings so take your time here. As you adjust the settings, consider if the results allow you to understand and interpret your results so that you can improve taste in the cup. For some, to much variation in the curves becomes hard to interpret, and the variation can be reduced by turning up the smoothing.
Filtering Raw Data - Input Filter
IMPORTANT NOTE: The filters below in this section ONLY are applied directly on the incoming data source before the data is recorded under Roast » Properties, Data tab. Therefore data eliminated by the min-max limit and the drop spikes filter is lost forever. This is in contrast to the other filters that in the remaining sections that work on the recorded raw data and their effect is used to improve the visualization.
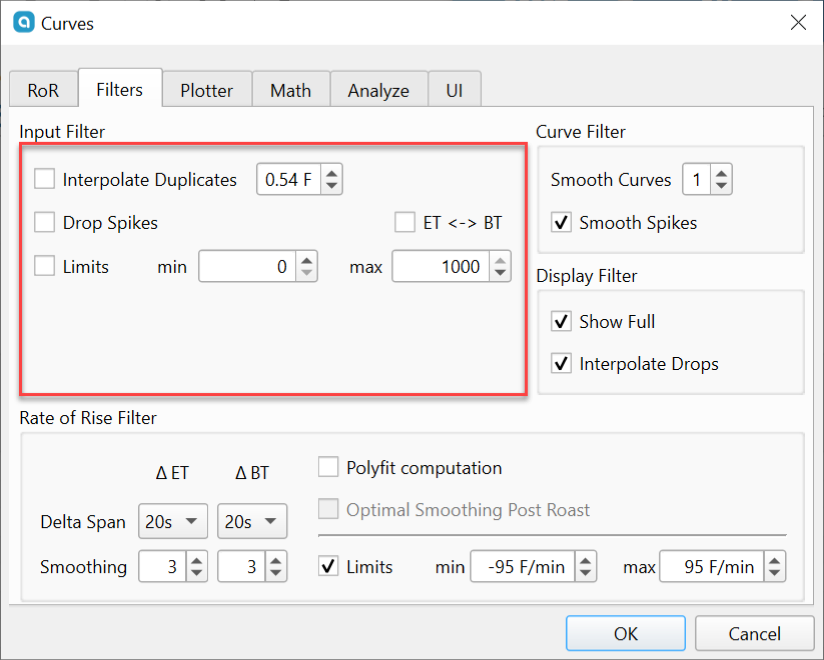
Interpolate Duplicates if duplicate samples are recorded, Artisan will look backwards and remove the duplicates. For example if you have 3 of the same readings, it will remove the duplicates and interpolate the the balance of the data. This filter handles instrumentation that can’t keep up with the sample rate and sends duplicate samples. You probably don’t need this.
Drop Spikes will drop huge spikes that are within your set limits. This filter removes all readings that would result in a delta value that is either very high or very low compared to the previous deltas. This filter can catch spikes that happen in the standard range temperature values which not be caught by the min-max filter.
Limits will allow you to set temp limits on how high or low your curve can go. This will keep your curves within reasonable ranges. This setting limits the readings accepted by Artisan to the specified range. Selecting the standard range of expected temperatures during a roast often eliminates most of the spikes, because meters experiencing electric noise often return very high or very low readings.
Swapping BT and ET without switching wires is easy. If you want to change the readings from the ET and BT probe to swap them, you do that on the filters tab of Curves dialog, by checking the box ET<->BT.
Filtering During the Roast Of All Curves - Impacting the Delta Curve Rendering During Roast - (Curve Filter)
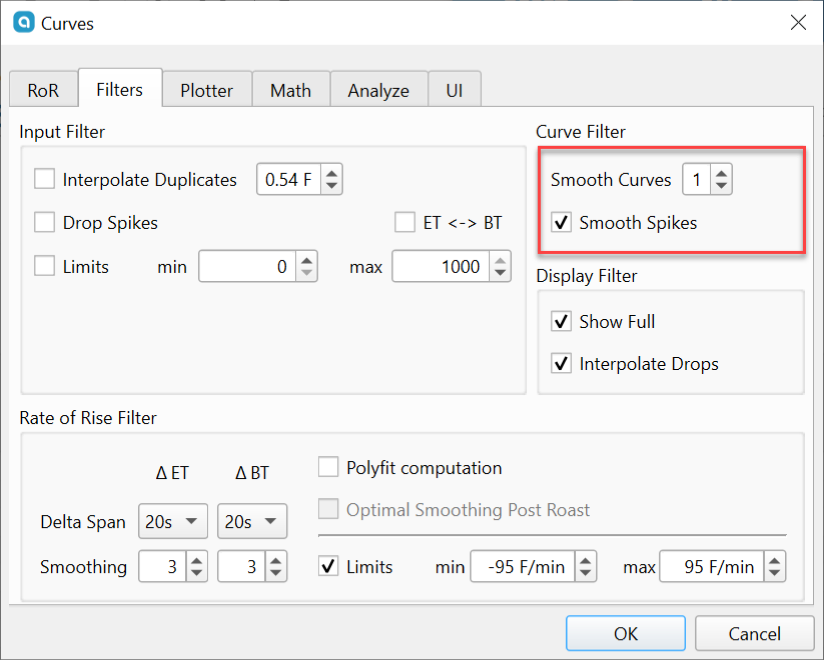
Smooth Curves will impact the BT, ET and Delta curves during the roast. These are smoothed by averaging using the same algorithm for “Smoothed Deltas” (decay smoothing). Here the setting is applied to the curves, incl. the BT/ET before the Delta values are computed. Applying Smooth Curves results in smoother deltas and also in a shift on the time axis. Adding Curve Smoothing larger than 0 results in different renderings during and after the roast. The maximum value is 5
NOTE that Smooth Curves settings are rendered post roast but the setting is used during the roast to calculate the Deltas shown. If you want the same smoothing applied during the roast and post roast, DON’T apply any Smooth Curves here and DON’T check “Optimal Smoothing Post Roast”.
Smooth Curves and RoR Filter are the two critical values you should adjust to your liking. You have to balance between being able to read the data that is not too noisy and making meaningful adjustments to your roasting. The only right answer is not what someone else sets, but how you use this to improve your own roasts and taste in the cup. Smooth Curves and RoR Filter also work on previously saved roasts. If you have Optimal Smoothing checked you will have that algorithm apply over the Smooth Curves settings post roast.
The best settings depend on the noise produced by your meter, probes and overall system as well as the sampling interval. In general apply only as much smoothing as strictly necessary. If you want the most accurate readings, your hardware should be chosen to fight noise before the roasting software, by selecting/configuring a meter to produce minimal noise, selecting probes that produce minimal noise, and protecting the system against ground-loop noise and electrical inferences. Probes with small diameter produce a lot more noise than larger diameter, and different probes of the same diameter can produce a different amount of noise.
Smooth Spikes will activate a further low-pass filter that eliminates tiny spikes that occur on some systems randomly due to some electronic noise. This filter is only applied offline if Optimal Smoothing is active.
Limit Data Shown – (Display Filter)
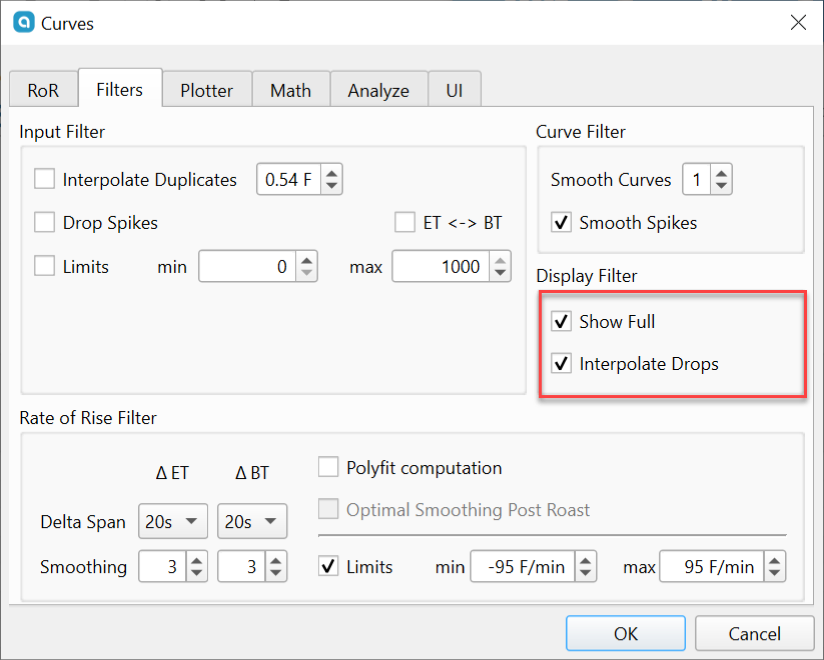
Show Full will show portions of the ET / BT curves before the Charge event, and after the Drop event.
Interpolate Drops is used the data drops out from the meters, and in this case Artisan will throw away the drops and interpolate the balance of the data.
Filtering During the Roast – Rate of Rise Filter
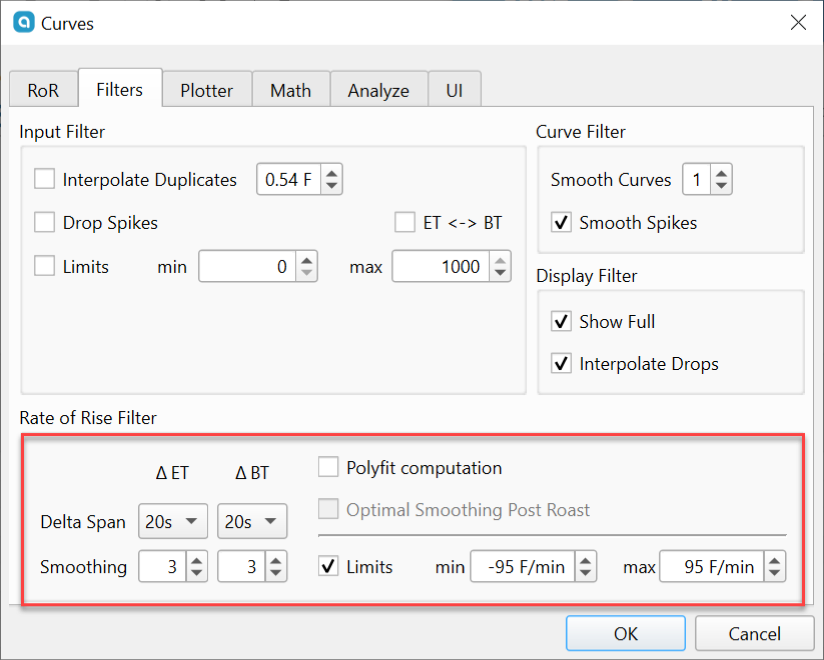
Delta Span affects how far back in time Artisan looks when calculating a delta curve. You can enter different values for the ET and BT curves. The maximum value is 30 seconds.
Increasing this setting smooths live-recording delta curves. Increasing this setting will not affect the standard temperature curves (ET/BT/etc.), only deltas. Delta Span is the period in seconds used to calculate basic/core RoR values by dividing the delta-temp/delta-time. Delta-time in the calculation is set by the Delta Span you choose. A Delta Span smaller than twice the sampling interval has no effect, larger Delta Spans lead to time shifts.
Smoothing values will impact only the delta curves and are applied after the Smooth Curves setting ONLY FOR THE DELTA CURVES during the roast. This allows for further smoothing of your Delta curves displayed during the roast. You can enter different values for the ET and BT curves. The maximum value is 40.
The value is proportional to the number of basic/core RoR values to be averaged to compute the final RoR values used for predictions and rendering. This smoothing process produces a shift on the time axis if “Optimal Smoothing Post Roast” is not checked (see below).
Polyfit computation computes the Rate-of-Rise signals based on linear polyfits (least squares). This technique results in a smoother Rate-of-Rise curve with larger delta-span values for signals containing high-frequency noise without the introduction of any additional delay.
Limits allows you to set temp limits on how high or low your ROR curves can go. This will keep your curves within reasonable ranges. This setting limits the readings calculated by Artisan to the specified range.
Filtering After the Roast - An Alternative
Optimal Smoothing Post Roast turns on a different smoothing algorithm that does not produce a time shift (optimal in that respect), and is applied only post roast. This option can not be selected unless you select the Polyfit computation. It needs a complete roast as it looks at data forward as well as backward and forward data is not there during a roast. If you turn this on, you will have different/shifted renderings of RoR during vs after roasting. Optimal Smoothing will override your Smooth Curves setting.
IMPORTANT NOTE: Except for the raw data filters described above, the filter settings can be changed after recording or even after an app restart and reload of the file (which stores the raw internal data only) to generate variations of the BT,ET and Delta curve rendering. If you send an Artisan file (.alog) to another user, they might get a different rendering on her screen depending on their filter settings, so you may want to send your settings file as well.
UI Tab
Make sure under the Curves dialog box, you do two things on the UI tab. Check the box for Decimal Places and investigate the fonts you can use for your graph. You can also set a Background Image. The shortcut COMMAND/CTRL +/- will increase or decrease graph resolution, and the resolution can be reset under the UI tab.
Many thanks to Rick Groszkiewicz for assisting in rewriting this page in 2025.