Roast Comparator
Menu: Tools » Comparator
The Comparator allows the roaster to compare profiles dynamically while Ranking Reports is static. The Comparator can include between batch protocols as well. The Ranking Reports function has sortable tables with the key data points of the selected roasts, and a chart of all selected profiles. With the Comparator you can add and remove curves in real time, realign based on a different roasting event such as charge or dry end. The Comparator is most useful to compare curves from roasting similar of identical beans from one crop or multiple crops. It is not great for comparing a natural Ethiopia to a washed Colombia!
Artisan includes many useful tools to improve your roasts. Profile Analyzer is great for analyzing one roast. Viewing a profile against a Background template is good for comparing two roasts. The Comparator is for analysis of multiple roasts of the same bean.
Loading Profiles

You start the Comparator mode by selecting its entry under the Tools menu and choose a set of profiles to be compared. If a profile or a background profile is loaded on starting the Comparator, those profiles will load. You can have a maximum of 10 profiles loaded. Any file double-clicked in the macOS Finder or Windows Explorer while Artisan is in the Comparator mode are added to the list. You can add sets of profiles from zip files as well.
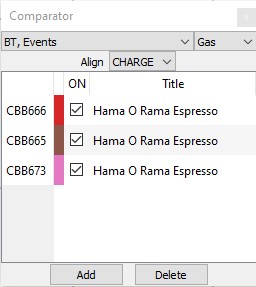
The profile batch number is rendered as row header, if available, otherwise an automatically generated number is used to identify the profile for the Comparator session. Each profile is assigned a color for its curve and a flag to completely hide that profile. The profiles title is editable, but changes will not be written back to the corresponding saved profile. Instead this feature serves to make temporary notes.
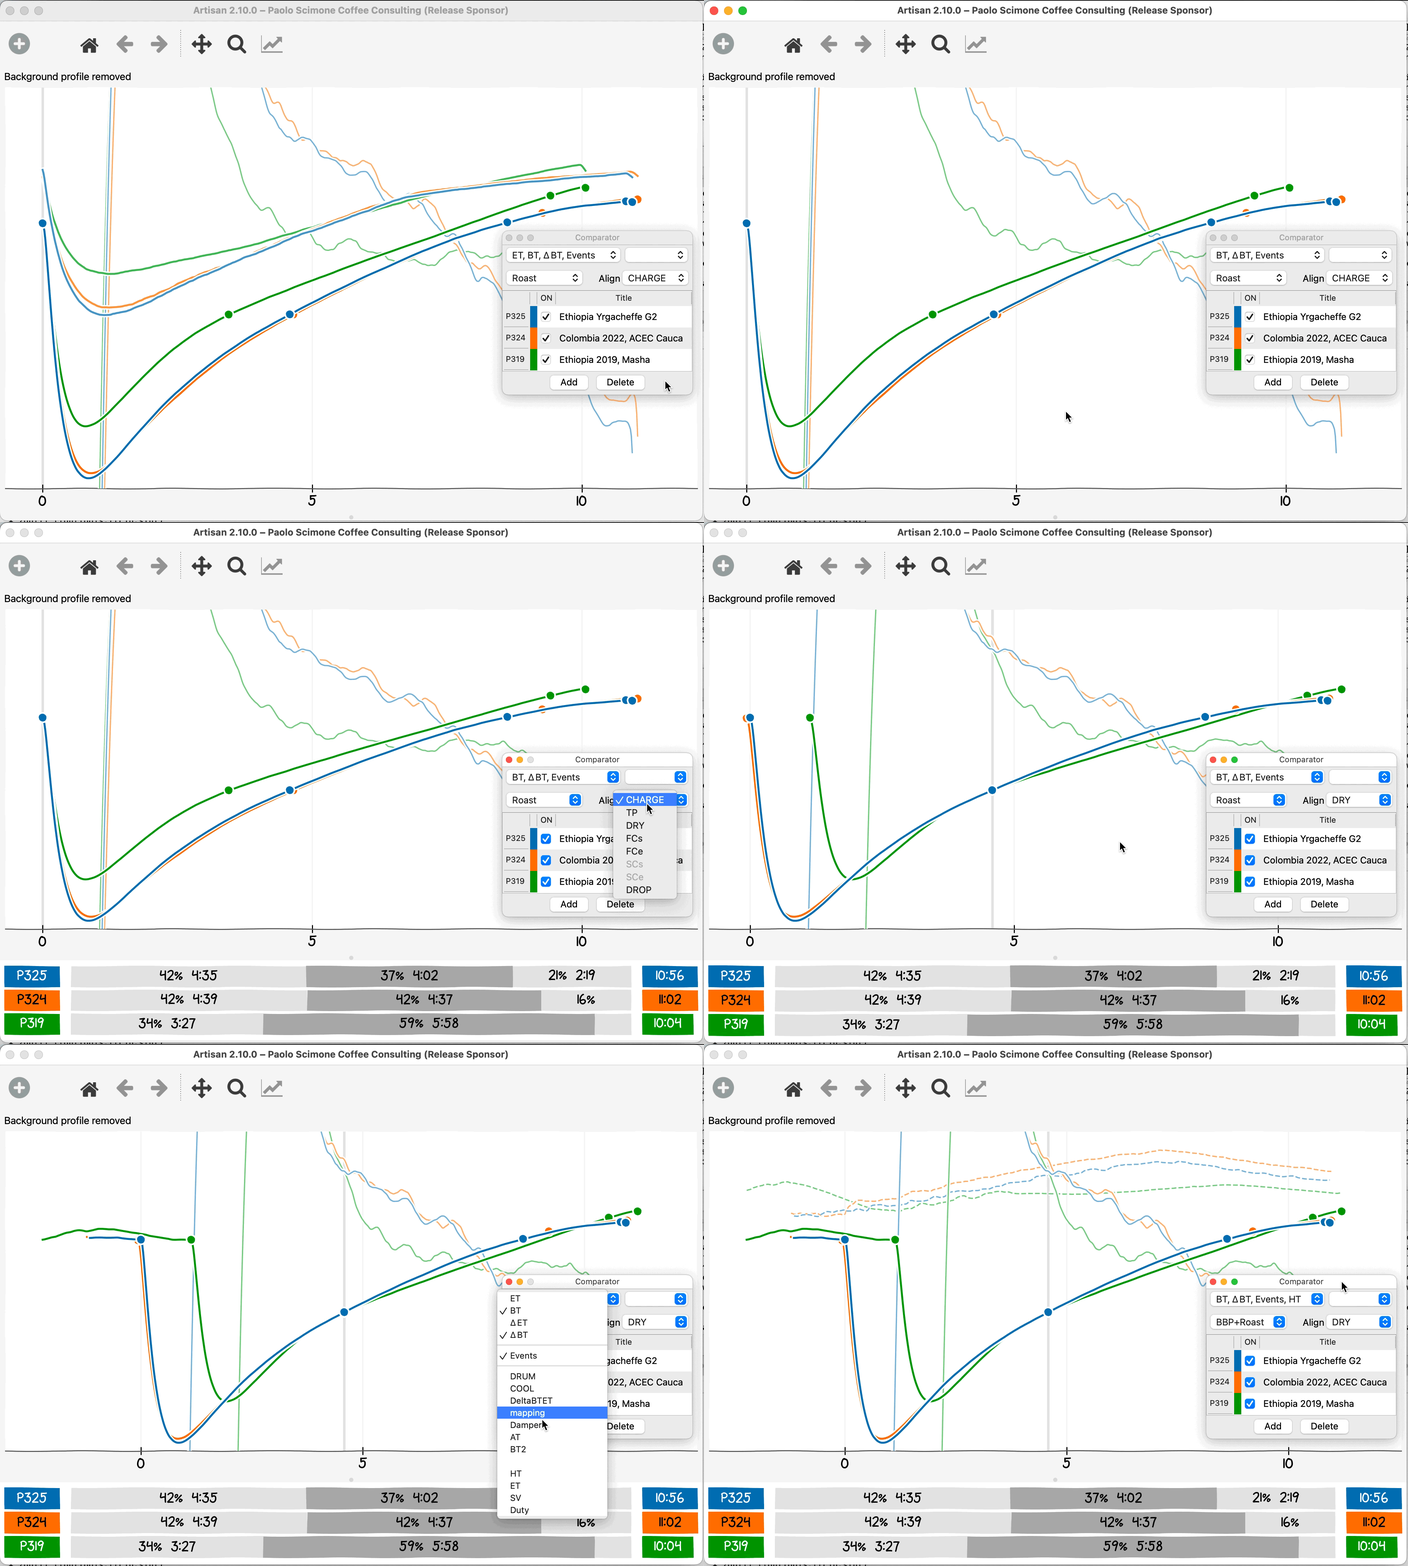
The two dropdown boxes on top of the tool window are used choose the curves to be displayed per profile and the dropdown on the next line specifies the event used to align the profiles to each other on the time axis. The order of profiles can be changed via drag-and-drop by grabbing the entries via their row headers.
Extra Devices
Originally only the BT and ET curves were available but now extra devices can be seen on the Comparator as well.

Tool Window
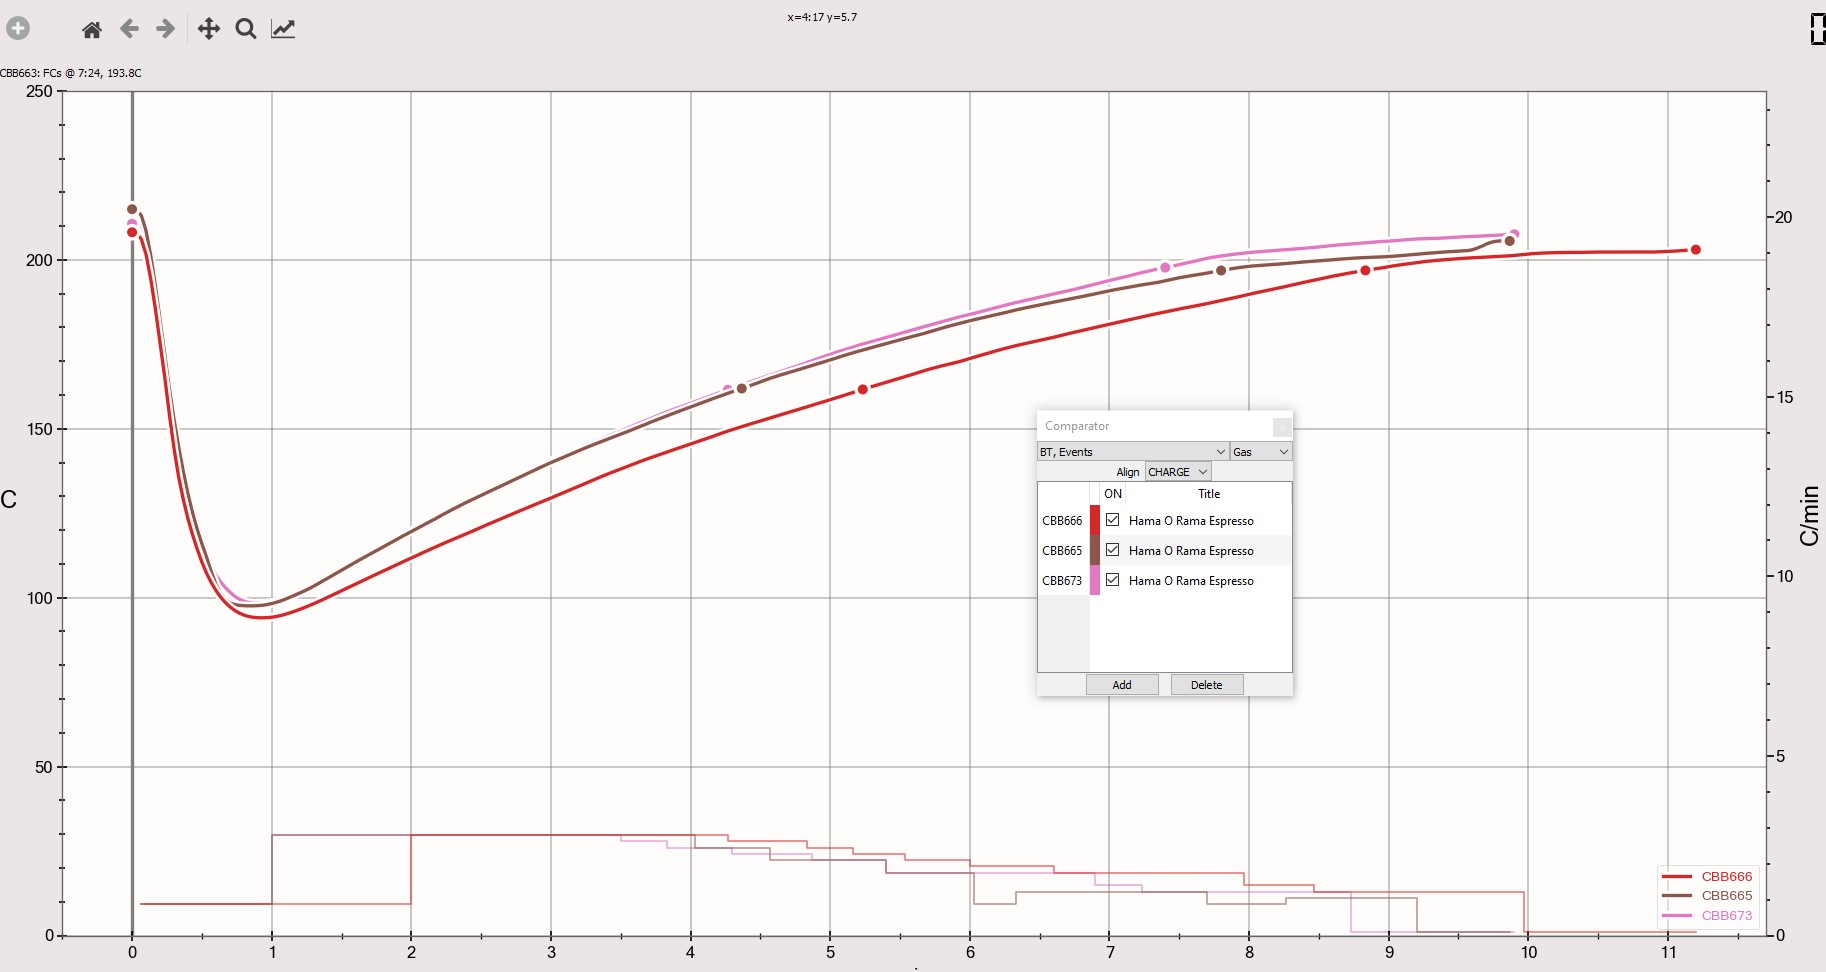
Events are rendered by small round markers on the main temperature curve of a profile (either bean temperature, BT, or environmental temperature, ET). A click on such a mark shows type, time and temperature of that event in the message line. Only one custom event type (e.g., gas or air) can be rendered as plain step line at the bottom of the window.

If profile rows are selected in the tool, all other profiles get rendered in grey scale to highlight the selected ones in the chart. A double click on a profile row header opens the corresponding profile in a second Artisan instance running in Viewer mode for further inspection. The Save Graph actions under menu File allow to export the graph in various file formats and direct printing is enabled as well.
For a slightly more detailed discussion see the Artisan Blog post.
Phases
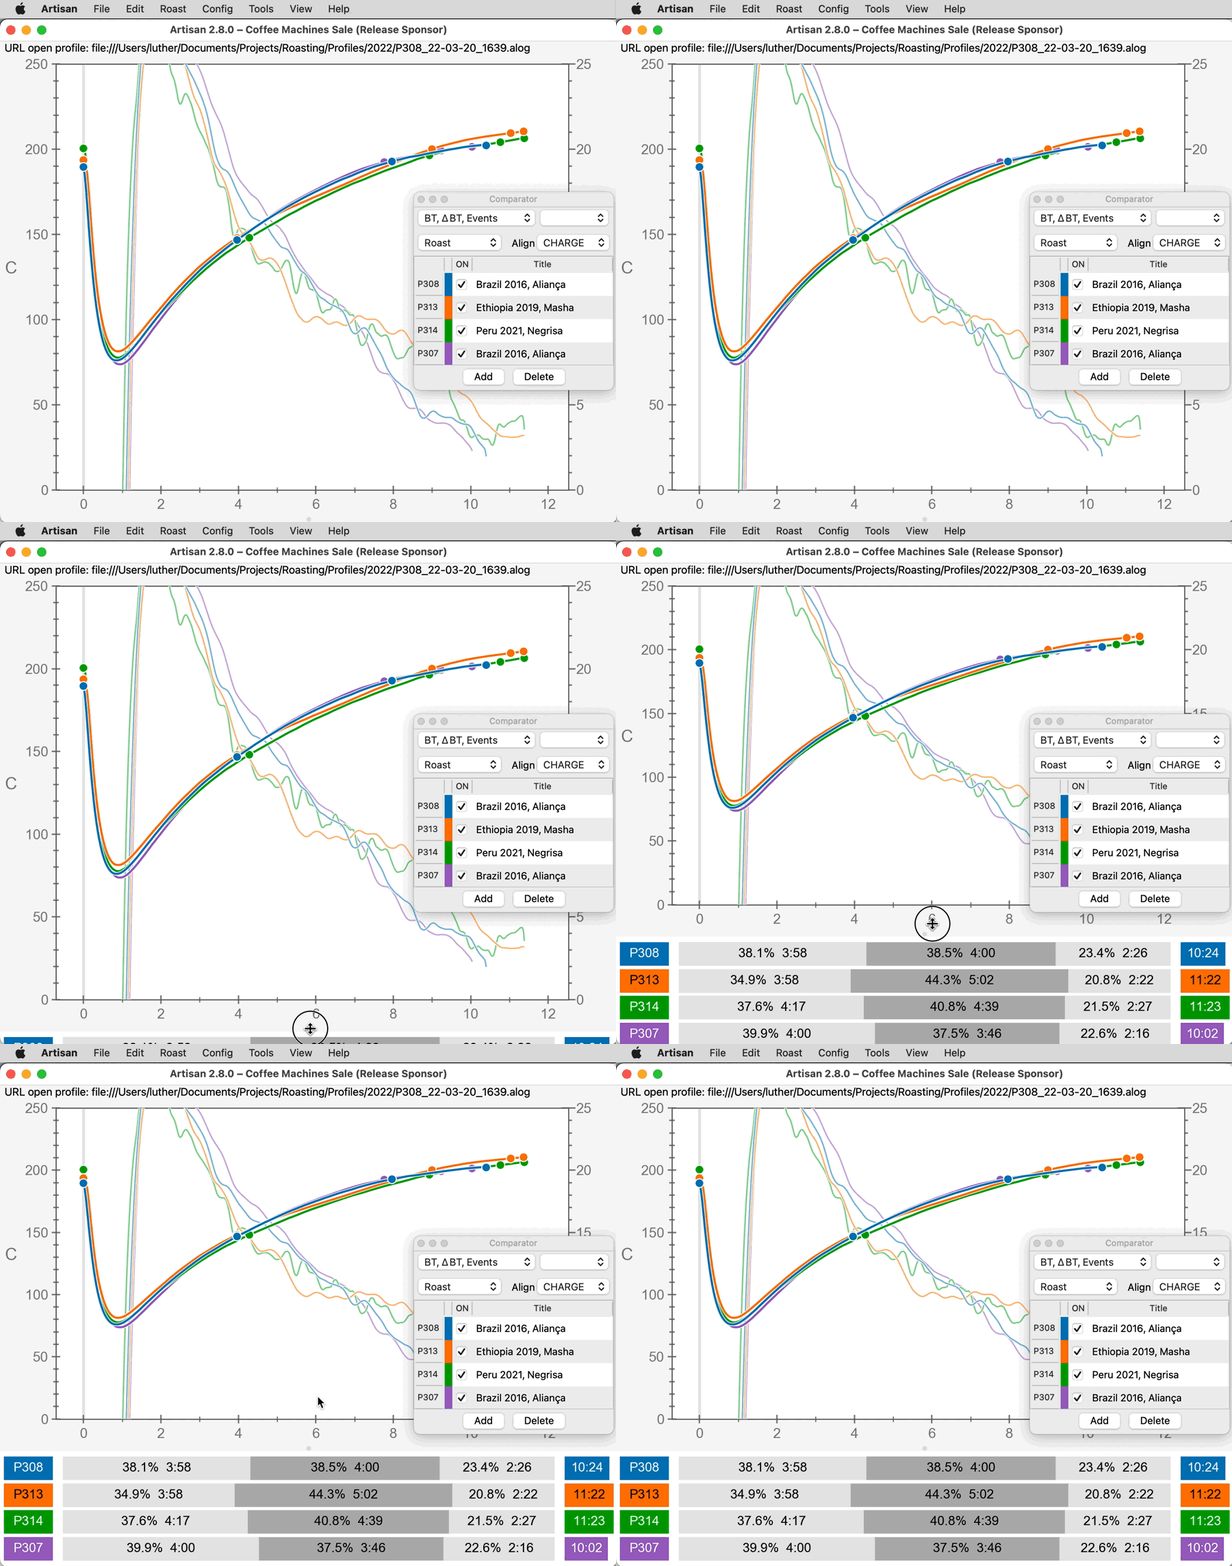
With a small handle at the bottom of the window you can pull up to open the view of the phases timing and percentages.

