
Phases
Menu: Config » Phases
Often roasters identify distinct roast phases.
- Drying: from heating the beans to the point where the beans turn yellow (DRY)
- Maillard: from DRY to the start of first crack (FCs)
- Finishing: from FCs to the end of the roast (DROP)
Artisan marks the drying phase in green, the Maillard phase in yellow and the finishing phase in brown. By checking Watermark, you can choose to have Artisan automatically mark phases with a watermark on the graph with time and temp. Checking the Watermarks and Phases LCD is essential. The Phases are shown at the end of the roast on your graph depending on your choices under Statistics.
In the Phases Dialog (menu Config » Phases) you can set the temperature limits of each phase. At the same time it is now possible in the Roast Phases dialog to define the display mode (Time, Percentage or Temperature - explained below) to be used on entering any of the three phases.
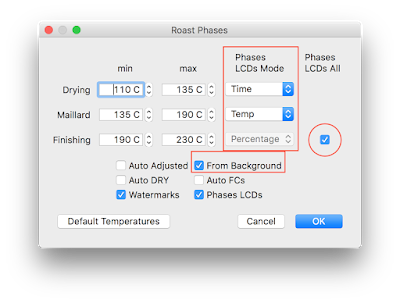
Roast phases can either be used in manual mode, where their temperature limits are defined in the corresponding dialog, or in Auto Adjusted mode, where those limits are taken from the corresponding DRY and FCs events as keyed during a roast. In manual mode some people activate AutoDRY and AutoFCs to let Artisan generate the corresponding events once the BT reaches the limits of the corresponding phases defined in the dialog box are reached. You can also choose to have DRY and FCs marked to a background profile by checking the From Background choice. So it’s really semi-automatic that way.
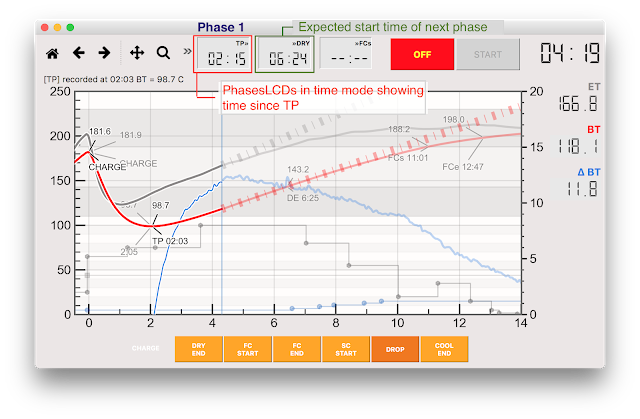
The Phases LCD’s are essential for your roasting. The Phases LCD are three small LCD panels at the top that displays information relative to the current progress of the roast and operates in one of three modes: time / percentage / temperature. A right click changes the mode between these three. In time mode for example after Turning Point, you will see an estimate of when Dry End will happen and the first LCD will show the time since TP, and based on the current ROR, when Dry will happen. These change as the roast progresses. After TP and Dry are complete small numbers between the LCDs show the time between the two. The most important is that you will have some idea of when FC is coming based on prior events and ROR and you can anticipate the need for air or gas changes.
In percentage mode you can see the % time in each phase. This is good to see the development time ratio after you have passed first crack. So right click.
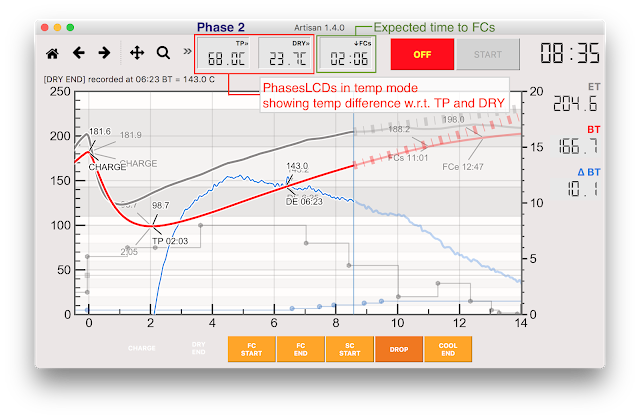
In temperature mode, you see the bean temperature change relative to the previous phase, so if you want to drop 10 degrees after first crack you can see that.
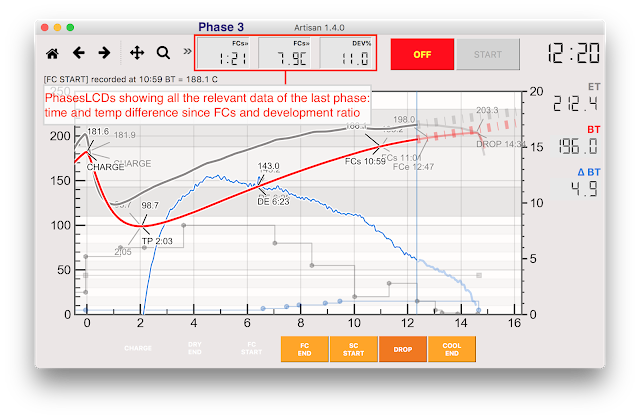
For the last phase, one can decide to display all information (time, temp and percentage) across the 3 available PhasesLCDs. Do this by ticking the flag at the end of the Finishing phase row. This specific mode avoids having to right-click the PhasesLCDs regular to check all this relevant information during that last busy phase. This is one of the best features of Artisan.. Much has been spoken about Development Time Ratio and there are a variety of ways to display it as documented in this Artisan Blog article.
Here are examples of how the three Phases LCDs work if you check the box to make them visible. Each of the three small LCDs relate to one of the three roasting phases.
Each of the LCDs displays information relative to the current progress of the roast and operates in one of three modes: time / percentage / temperature.
For example, in the following situation, the roast just passed the turning point (TP) and is approaching DRY. The phasesLCDs are in time mode. The TP LCD indicates that 2:15 minutes have passed since TP and that, based on the current RoR, DRY is expected to happen 6:24 minutes into the roast. The last LCD does not have any meaningful information to be displayed yet.
A little bit further into that roast the LCDs are in temp mode per the choice made above, and you can see the temperature change since TP and since Dry started. You can see the time remaining until FCs.
Finally, 1:21 ago we reached FCs, and the temp has changed 7.9C since then. Development time ratio is 11%. Many people are focused on a 20%-25% development ratio. Displaying the development time ratio can be done in a variety of ways.
By ticking the From Background flag one can instruct Artisan to read phases information on loading a background profile and set the temperature limits of each phase based on the Dry End and First Crack start from the background roast.